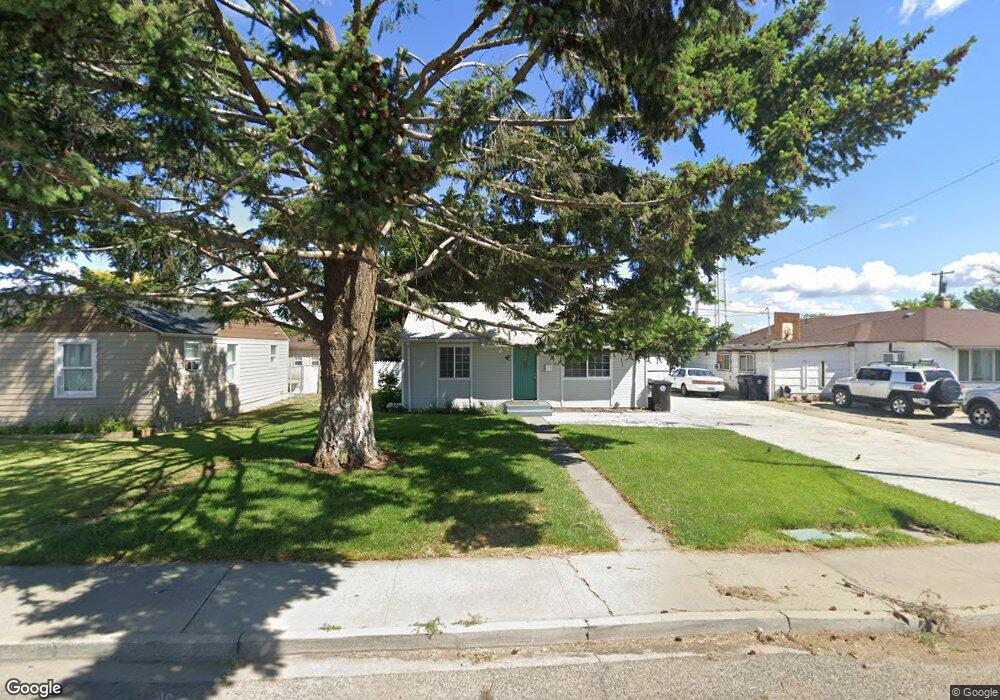
515 W 3rd Ave Toppenish, WA 98948
Estimated Value: $198,955 - $241,000
2
Beds
1
Bath
780
Sq Ft
$281/Sq Ft
Est. Value
About This Home
This home is located at 515 W 3rd Ave, Toppenish, WA 98948 and is currently estimated at $219,239, approximately $281 per square foot. 515 W 3rd Ave is a home located in Yakima County with nearby schools including Toppenish High School.
Ownership History
Date
Name
Owned For
Owner Type
Purchase Details
Closed on
Oct 12, 2016
Sold by
Gutierrez Luis
Bought by
Alvarez Maria De Jesus
Current Estimated Value
Home Financials for this Owner
Home Financials are based on the most recent Mortgage that was taken out on this home.
Original Mortgage
$108,498
Outstanding Balance
$87,420
Interest Rate
3.62%
Mortgage Type
FHA
Estimated Equity
$131,819
Purchase Details
Closed on
Mar 13, 2009
Sold by
Gutierrez Jose M
Bought by
Gutierrez Luis
Purchase Details
Closed on
Oct 9, 2002
Sold by
Rodriguez Leonel L and Rodriguez Eva
Bought by
Gutierrez Jose M and Gutierrez Luis
Home Financials for this Owner
Home Financials are based on the most recent Mortgage that was taken out on this home.
Original Mortgage
$76,196
Interest Rate
6.17%
Mortgage Type
FHA
Create a Home Valuation Report for This Property
The Home Valuation Report is an in-depth analysis detailing your home's value as well as a comparison with similar homes in the area
Home Values in the Area
Average Home Value in this Area
Purchase History
| Date | Buyer | Sale Price | Title Company |
|---|---|---|---|
| Alvarez Maria De Jesus | $110,500 | Pacific Alliance Title | |
| Gutierrez Luis | -- | None Available | |
| Gutierrez Jose M | $77,000 | Pacific Alliance Title Co |
Source: Public Records
Mortgage History
| Date | Status | Borrower | Loan Amount |
|---|---|---|---|
| Open | Alvarez Maria De Jesus | $108,498 | |
| Previous Owner | Gutierrez Jose M | $76,196 |
Source: Public Records
Tax History Compared to Growth
Tax History
| Year | Tax Paid | Tax Assessment Tax Assessment Total Assessment is a certain percentage of the fair market value that is determined by local assessors to be the total taxable value of land and additions on the property. | Land | Improvement |
|---|---|---|---|---|
| 2025 | $1,704 | $198,200 | $41,600 | $156,600 |
| 2023 | $1,624 | $126,700 | $35,300 | $91,400 |
| 2022 | $1,357 | $119,900 | $36,300 | $83,600 |
| 2021 | $1,520 | $108,300 | $32,600 | $75,700 |
| 2019 | $1,106 | $94,300 | $28,900 | $65,400 |
| 2018 | $864 | $73,100 | $27,700 | $45,400 |
| 2017 | $771 | $73,100 | $27,700 | $45,400 |
| 2016 | $797 | $73,550 | $27,650 | $45,900 |
| 2015 | $797 | $70,250 | $27,650 | $42,600 |
| 2014 | $797 | $70,250 | $27,650 | $42,600 |
| 2013 | $797 | $70,250 | $27,650 | $42,600 |
Source: Public Records
Map
Nearby Homes
- 516 W 3rd Ave
- 309 & 309 W 2nd Ave
- 542 Lillie Ln
- 603 S Toppenish Ave
- 10 S Date St
- 108 S Fir St
- 3 S Elm St
- 914 Madison Ave
- 300 Fort Rd
- 151 W Elmwood Ln
- 412 Maple Ct
- 97 E McDonald Rd
- 1007 Vintage Valley Pkwy
- 270 Cheyne Rd
- 314 2nd Ave
- 1550 Buena Rd
- NKA Buena Rd
- 704 Fountain Blvd
- 8019 Vialago Pkwy
- 712 Fountain Blvd