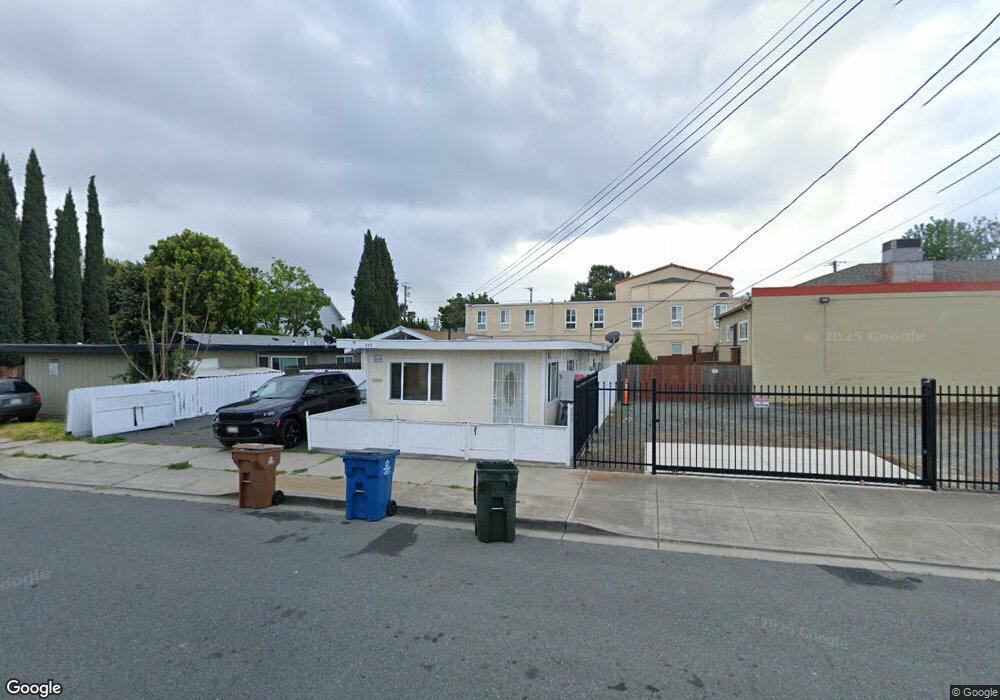
515 W 5th St Unit B Antioch, CA 94509
North Antioch NeighborhoodEstimated Value: $492,000 - $565,000
1
Bed
1
Bath
600
Sq Ft
$888/Sq Ft
Est. Value
About This Home
This home is located at 515 W 5th St Unit B, Antioch, CA 94509 and is currently estimated at $532,948, approximately $888 per square foot. 515 W 5th St Unit B is a home located in Contra Costa County with nearby schools including Fremont Elementary School, Antioch Middle School, and Antioch High School.
Ownership History
Date
Name
Owned For
Owner Type
Purchase Details
Closed on
Aug 31, 2016
Sold by
Gamarra Orlando and Gamarra Virma
Bought by
Gamarra Wyliam
Current Estimated Value
Home Financials for this Owner
Home Financials are based on the most recent Mortgage that was taken out on this home.
Original Mortgage
$105,000
Outstanding Balance
$87,528
Interest Rate
4.87%
Mortgage Type
Adjustable Rate Mortgage/ARM
Estimated Equity
$445,420
Purchase Details
Closed on
Nov 19, 2013
Sold by
Mcinelly Bonnie G
Bought by
Gamarra Orlando and Gamarra Virma
Create a Home Valuation Report for This Property
The Home Valuation Report is an in-depth analysis detailing your home's value as well as a comparison with similar homes in the area
Home Values in the Area
Average Home Value in this Area
Purchase History
| Date | Buyer | Sale Price | Title Company |
|---|---|---|---|
| Gamarra Wyliam | -- | Placer Title Company | |
| Gamarra Orlando | $215,000 | Old Republic Title Company |
Source: Public Records
Mortgage History
| Date | Status | Borrower | Loan Amount |
|---|---|---|---|
| Open | Gamarra Wyliam | $105,000 |
Source: Public Records
Tax History Compared to Growth
Tax History
| Year | Tax Paid | Tax Assessment Tax Assessment Total Assessment is a certain percentage of the fair market value that is determined by local assessors to be the total taxable value of land and additions on the property. | Land | Improvement |
|---|---|---|---|---|
| 2025 | $3,924 | $263,181 | $94,386 | $168,795 |
| 2024 | $3,808 | $258,022 | $92,536 | $165,486 |
| 2023 | $3,808 | $252,964 | $90,722 | $162,242 |
| 2022 | $3,759 | $248,005 | $88,944 | $159,061 |
| 2021 | $3,611 | $243,143 | $87,200 | $155,943 |
| 2019 | $3,525 | $235,932 | $84,614 | $151,318 |
| 2018 | $3,399 | $231,306 | $82,955 | $148,351 |
| 2017 | $3,301 | $226,772 | $81,329 | $145,443 |
| 2016 | $3,209 | $222,327 | $79,735 | $142,592 |
| 2015 | $3,160 | $218,989 | $78,538 | $140,451 |
| 2014 | $3,057 | $214,700 | $77,000 | $137,700 |
Source: Public Records
Map
Nearby Homes