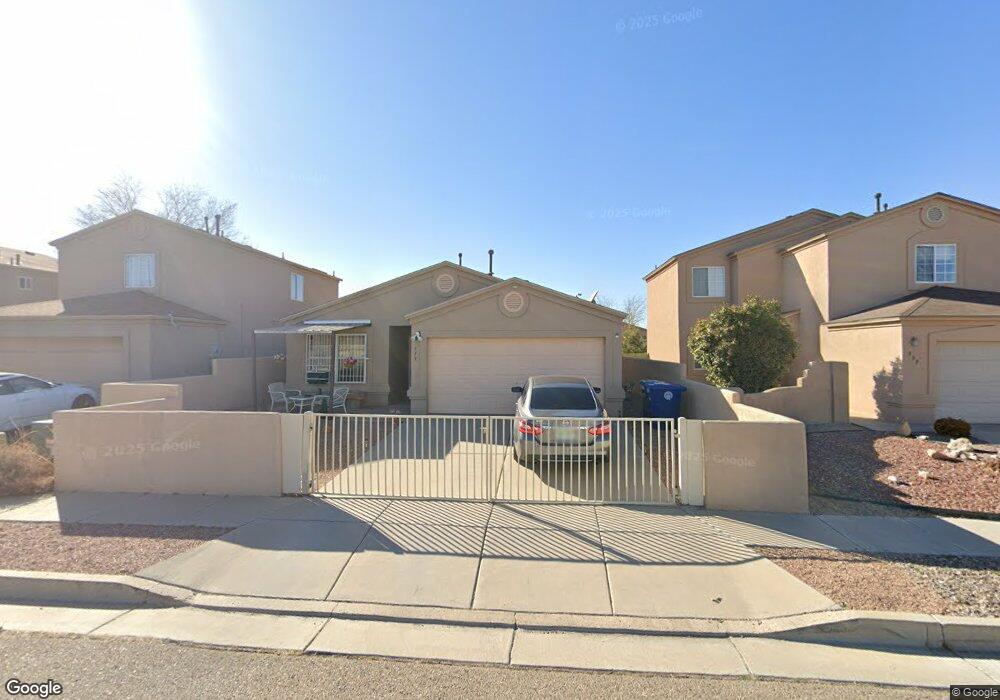
515 Whisper Dr SW Albuquerque, NM 87121
Southwest Heights NeighborhoodEstimated Value: $247,000 - $276,000
2
Beds
2
Baths
1,098
Sq Ft
$240/Sq Ft
Est. Value
About This Home
This home is located at 515 Whisper Dr SW, Albuquerque, NM 87121 and is currently estimated at $263,036, approximately $239 per square foot. 515 Whisper Dr SW is a home located in Bernalillo County with nearby schools including Helen Cordero Primary School, Edward Gonzales Elementary School, and Jimmy Carter Middle School.
Ownership History
Date
Name
Owned For
Owner Type
Purchase Details
Closed on
Apr 12, 2012
Sold by
Al Mateen Brenda
Bought by
Moyer Mary
Current Estimated Value
Home Financials for this Owner
Home Financials are based on the most recent Mortgage that was taken out on this home.
Original Mortgage
$91,200
Outstanding Balance
$63,023
Interest Rate
3.92%
Mortgage Type
New Conventional
Estimated Equity
$200,013
Purchase Details
Closed on
Dec 14, 2004
Sold by
Vantage Builders Inc
Bought by
Young Calvin R
Purchase Details
Closed on
Aug 31, 2004
Sold by
C & W Land Development Enterprises Inc
Bought by
Vantage Builders Inc
Home Financials for this Owner
Home Financials are based on the most recent Mortgage that was taken out on this home.
Original Mortgage
$10,000,000
Interest Rate
5.97%
Mortgage Type
Credit Line Revolving
Create a Home Valuation Report for This Property
The Home Valuation Report is an in-depth analysis detailing your home's value as well as a comparison with similar homes in the area
Home Values in the Area
Average Home Value in this Area
Purchase History
| Date | Buyer | Sale Price | Title Company |
|---|---|---|---|
| Moyer Mary | -- | First American Title Ins Co | |
| Young Calvin R | -- | Landamerica New Mexico Title | |
| Vantage Builders Inc | -- | Landamerica New Mexico Title |
Source: Public Records
Mortgage History
| Date | Status | Borrower | Loan Amount |
|---|---|---|---|
| Open | Moyer Mary | $91,200 | |
| Previous Owner | Vantage Builders Inc | $10,000,000 |
Source: Public Records
Tax History Compared to Growth
Tax History
| Year | Tax Paid | Tax Assessment Tax Assessment Total Assessment is a certain percentage of the fair market value that is determined by local assessors to be the total taxable value of land and additions on the property. | Land | Improvement |
|---|---|---|---|---|
| 2024 | $1,541 | $36,519 | $11,863 | $24,656 |
| 2023 | $1,515 | $35,456 | $11,518 | $23,938 |
| 2022 | $1,464 | $34,424 | $11,183 | $23,241 |
| 2021 | $1,415 | $33,421 | $10,857 | $22,564 |
| 2020 | $1,392 | $32,448 | $10,541 | $21,907 |
| 2019 | $1,351 | $31,503 | $10,234 | $21,269 |
| 2018 | $1,303 | $31,503 | $10,234 | $21,269 |
| 2017 | $1,263 | $30,586 | $9,936 | $20,650 |
| 2016 | $1,227 | $28,831 | $9,366 | $19,465 |
| 2015 | $29,031 | $29,031 | $9,366 | $19,665 |
| 2014 | $1,233 | $29,031 | $9,366 | $19,665 |
| 2013 | -- | $29,231 | $9,366 | $19,865 |
Source: Public Records
Map
Nearby Homes
- 527 Whisper Mesa St SW
- 8009 Vista Estrella Ln SW
- 427 Bluethorn Ct SW
- 7612 Via Belleza SW
- 424 Whitethorn St SW
- 7605 Via Belleza SW
- 7524 Via Belleza SW
- 615 82nd St SW
- 7535 Via Tranquilo SW
- 519 Fenwick Place SW
- 3525 Tower Rd SW
- 8308 Vista Chamisa Ln SW
- 0 Nna Unser&tower SW Unit 1081416
- 8700 Thor Rd SW
- 8709 Odin Rd SW
- 961 Berman St SW
- Wellton Plan at Estrella at High Range
- Mesquite Plan at Estrella at High Range
- Bisbee Plan at Estrella at High Range
- Somerton Plan at Estrella at High Range
- 515 Whisper Pointe St SW
- 509 Whisper Dr SW
- 519 Whisper Dr SW
- 505 Whisper Dr SW
- 505 Whisper Pointe St SW
- 505 Whisper Pointe St SW
- 523 Whisper Dr SW
- 512 Whispering St SW
- 508 Whispering St SW
- 504 Whispering St SW
- 501 Whisper Pointe St SW
- 501 Whisper Dr SW
- 516 Whispering St SW
- 527 Whisper Pointe St SW
- 527 Whisper Pointe St SW
- 527 Whisper Dr SW
- 512 Whisper Dr SW
- 516 Whisper Pointe St SW
- 500 Whispering St SW
- 508 Whisper Dr SW