Estimated Value: $502,000 - $552,368
4
Beds
4
Baths
1,753
Sq Ft
$299/Sq Ft
Est. Value
About This Home
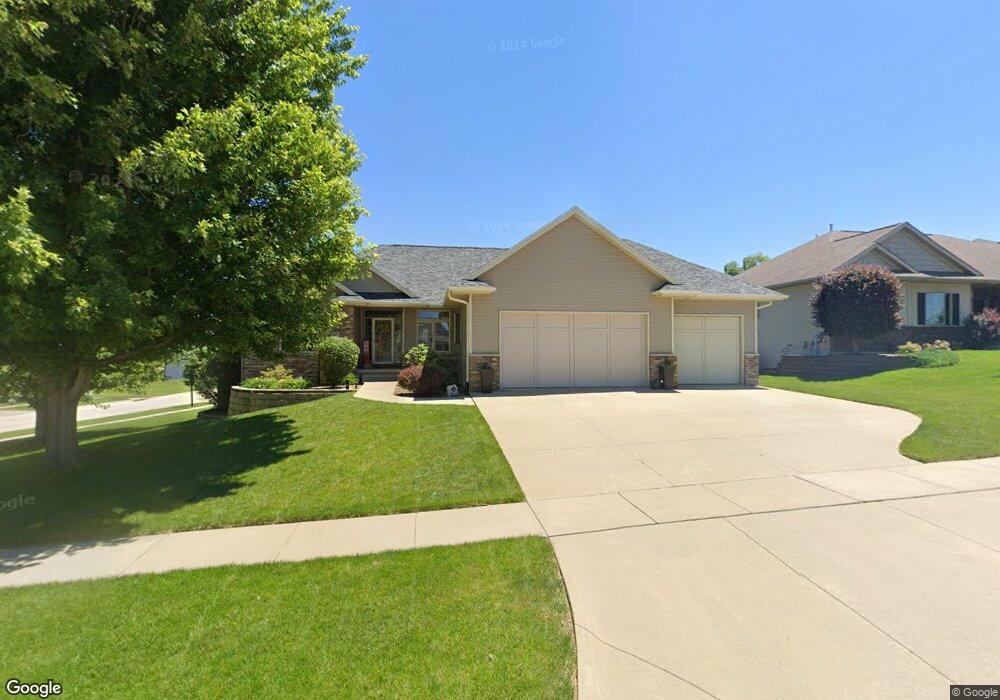
This home is located at 515 Whispering Willow Ln, Solon, IA 52333 and is currently estimated at $524,592, approximately $299 per square foot. 515 Whispering Willow Ln is a home located in Johnson County with nearby schools including Lakeview Elementary School, Solon Middle School, and Solon High School.
Ownership History
Date
Name
Owned For
Owner Type
Purchase Details
Closed on
Aug 1, 2007
Sold by
Ouaintance Eric and Ouaintance Emmy L
Bought by
Hoskyn William J and Hoskyn Lori K
Current Estimated Value
Home Financials for this Owner
Home Financials are based on the most recent Mortgage that was taken out on this home.
Original Mortgage
$238,800
Outstanding Balance
$150,733
Interest Rate
6.69%
Mortgage Type
New Conventional
Estimated Equity
$373,859
Purchase Details
Closed on
Oct 10, 2006
Sold by
Windmill Estates Inc
Bought by
Quaintance Eric and Quaintance Emmy L
Home Financials for this Owner
Home Financials are based on the most recent Mortgage that was taken out on this home.
Original Mortgage
$260,000
Interest Rate
6.5%
Mortgage Type
Construction
Create a Home Valuation Report for This Property
The Home Valuation Report is an in-depth analysis detailing your home's value as well as a comparison with similar homes in the area
Home Values in the Area
Average Home Value in this Area
Purchase History
| Date | Buyer | Sale Price | Title Company |
|---|---|---|---|
| Hoskyn William J | $298,500 | None Available | |
| Quaintance Eric | $58,500 | None Available |
Source: Public Records
Mortgage History
| Date | Status | Borrower | Loan Amount |
|---|---|---|---|
| Open | Hoskyn William J | $238,800 | |
| Previous Owner | Quaintance Eric | $260,000 |
Source: Public Records
Tax History Compared to Growth
Tax History
| Year | Tax Paid | Tax Assessment Tax Assessment Total Assessment is a certain percentage of the fair market value that is determined by local assessors to be the total taxable value of land and additions on the property. | Land | Improvement |
|---|---|---|---|---|
| 2025 | $8,440 | $550,100 | $89,100 | $461,000 |
| 2024 | $8,204 | $508,400 | $89,100 | $419,300 |
| 2023 | $7,500 | $508,400 | $89,100 | $419,300 |
| 2022 | $7,414 | $400,400 | $61,000 | $339,400 |
| 2021 | $7,038 | $400,400 | $61,000 | $339,400 |
| 2020 | $7,038 | $364,700 | $61,000 | $303,700 |
| 2019 | $6,766 | $364,700 | $61,000 | $303,700 |
| 2018 | $6,632 | $346,800 | $61,000 | $285,800 |
| 2017 | $6,806 | $346,800 | $61,000 | $285,800 |
| 2016 | $6,110 | $345,400 | $61,000 | $284,400 |
| 2015 | $6,110 | $321,100 | $61,000 | $260,100 |
| 2014 | $6,254 | $316,300 | $61,000 | $255,300 |
Source: Public Records
Map
Nearby Homes
- 600 Majestic Oak Ridge
- 707 Cedar Bend Dr
- 715 Cedar Bend Dr
- 403 E Main St
- 405 E Main St
- 406 Plum St
- 922 Oakland Trail
- 606 Windsor Dr
- 401 S Market St
- 1108 High Ridge Trail
- 513 S Dubuque St
- 730 S Market St Unit 12
- 730 S Market St Unit 24
- 730 S Market St
- 0 Anders 1st Addition
- 902 Long Dr
- 915 Long Dr
- 901 Long Dr
- 936 Long Dr
- 920 Long Dr
- 513 Whispering Willow Ln
- 609 Majestic Oak Ridge
- 514 Whispering Willow Ln
- 606 Majestic Oak Ridge
- 511 Whispering Willow Ln
- 608 Majestic Oak Ridge
- 611 Majestic Oak Ridge
- 512 Whispering Willow Ln
- 610 Majestic Oak Ridge
- 604 Majestic Oak Ridge
- 510 Whispering Willow Ln
- 509 Whispering Willow Ln
- 602 Majestic Oak Ridge
- 612 Majestic Oak Ridge
- 613 Majestic Oak Ridge
- 508 Whispering Willow Ln
- 506 River Birch Run
- Lot 60 Windmill Estates Unit 612 Majestic Oak Rid
- 504 River Birch Run
- Lot 41 Windmill Estates