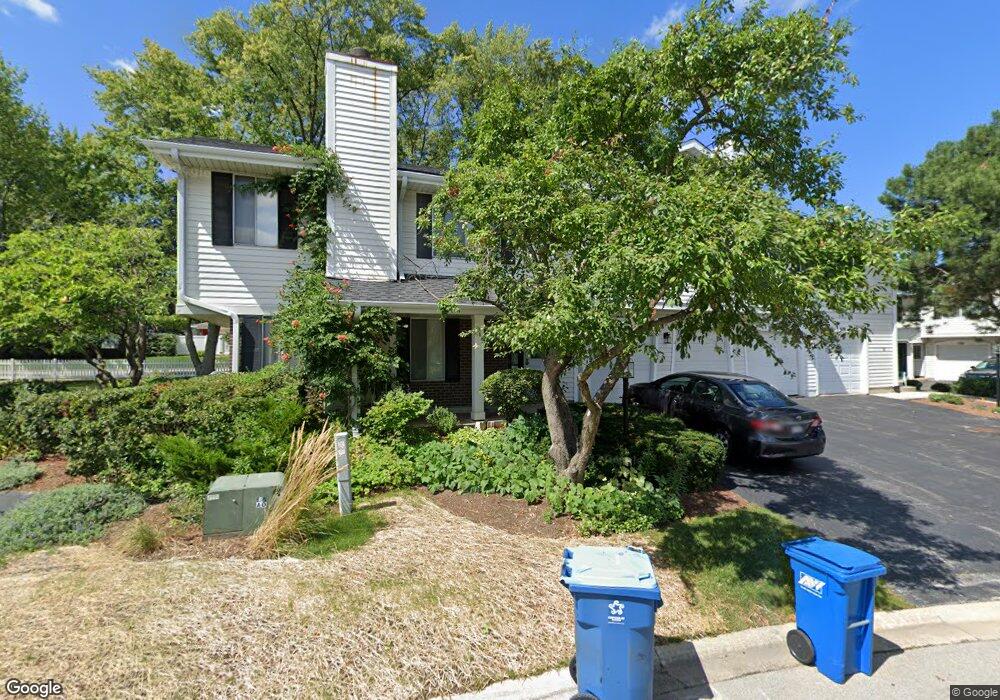
515 Willowcreek Ct Unit 3 Clarendon Hills, IL 60514
Estimated Value: $219,000 - $321,000
2
Beds
1
Bath
1,161
Sq Ft
$248/Sq Ft
Est. Value
About This Home
This home is located at 515 Willowcreek Ct Unit 3, Clarendon Hills, IL 60514 and is currently estimated at $288,176, approximately $248 per square foot. 515 Willowcreek Ct Unit 3 is a home located in DuPage County with nearby schools including Holmes Elementary School, Maercker Elementary School, and Westview Hills Middle School.
Ownership History
Date
Name
Owned For
Owner Type
Purchase Details
Closed on
Dec 2, 2019
Sold by
Mclaughlin Roisian and Robinson Rosin
Bought by
Mclaughlin Roisin and Roisian Cmlaughlin Trust
Current Estimated Value
Purchase Details
Closed on
Aug 19, 2003
Sold by
Sherman Robert and Sherman Joni L
Bought by
Robinson Roisin
Home Financials for this Owner
Home Financials are based on the most recent Mortgage that was taken out on this home.
Original Mortgage
$140,800
Outstanding Balance
$62,002
Interest Rate
5.62%
Mortgage Type
Purchase Money Mortgage
Estimated Equity
$226,174
Purchase Details
Closed on
Jul 18, 2001
Sold by
Wildman Peter R
Bought by
Sherman Robert and Sherman Joni L
Home Financials for this Owner
Home Financials are based on the most recent Mortgage that was taken out on this home.
Original Mortgage
$117,600
Interest Rate
7.22%
Mortgage Type
Purchase Money Mortgage
Create a Home Valuation Report for This Property
The Home Valuation Report is an in-depth analysis detailing your home's value as well as a comparison with similar homes in the area
Home Values in the Area
Average Home Value in this Area
Purchase History
| Date | Buyer | Sale Price | Title Company |
|---|---|---|---|
| Mclaughlin Roisin | -- | Attorney | |
| Robinson Roisin | $176,000 | First American Title | |
| Sherman Robert | $147,000 | -- |
Source: Public Records
Mortgage History
| Date | Status | Borrower | Loan Amount |
|---|---|---|---|
| Open | Robinson Roisin | $140,800 | |
| Previous Owner | Sherman Robert | $117,600 | |
| Closed | Sherman Robert | $15,000 |
Source: Public Records
Tax History Compared to Growth
Tax History
| Year | Tax Paid | Tax Assessment Tax Assessment Total Assessment is a certain percentage of the fair market value that is determined by local assessors to be the total taxable value of land and additions on the property. | Land | Improvement |
|---|---|---|---|---|
| 2024 | $4,190 | $82,487 | $15,033 | $67,454 |
| 2023 | $4,407 | $75,830 | $13,820 | $62,010 |
| 2022 | $3,936 | $67,040 | $12,220 | $54,820 |
| 2021 | $3,822 | $66,280 | $12,080 | $54,200 |
| 2020 | $3,755 | $64,970 | $11,840 | $53,130 |
| 2019 | $3,615 | $62,340 | $11,360 | $50,980 |
| 2018 | $3,236 | $56,930 | $10,370 | $46,560 |
| 2017 | $2,806 | $50,710 | $9,980 | $40,730 |
| 2016 | $2,520 | $44,860 | $9,520 | $35,340 |
| 2015 | $2,476 | $42,210 | $8,960 | $33,250 |
| 2014 | $2,484 | $41,880 | $8,890 | $32,990 |
| 2013 | $2,424 | $41,690 | $8,850 | $32,840 |
Source: Public Records
Map
Nearby Homes
- 564 Willowcreek Ct Unit 411
- 539 Willowcreek Ct Unit 317
- 501 Carlysle Dr Unit 9
- 550 Chase Dr Unit 2
- 550 Chase Dr Unit 14
- 5740 Concord Ln Unit 12
- 5730 Concord Ln Unit 3
- 5841 Sunrise Ave
- 5701 Clarendon Hills Rd
- 5545 S Stough St
- 217 55th St
- 264 Holmes Ave
- 818 W 58th St
- 5524 S Bruner St
- 5508 S Bruner St
- 5515 Alabama Ave
- 5865 Alabama Ave
- 5875 Alabama Ave
- 5848 Clarendon Hills Rd
- 230 Holmes Ave
- 536 Willowcreek Ct Unit 28
- 561 Willowcreek Ct Unit 12
- 575 Willowcreek Ct Unit 43
- 584 Willowcreek Ct Unit 314
- 549 Willowcreek Ct Unit 318
- 560 Willowcreek Ct Unit 211
- 563 Willowcreek Ct Unit 22
- 547 Willowcreek Ct Unit 218
- 572 Willowcreek Ct Unit 112
- 577 Willowcreek Ct Unit 14
- 557 Willowcreek Ct Unit 21
- 559 Willowcreek Ct Unit 11
- 552 Willowcreek Ct Unit 210
- 591 Willowcreek Ct Unit 15
- 590 Willowcreek Ct Unit 414
- 527 Willowcreek Ct Unit 415
- 525 Willowcreek Ct Unit 315
- 548 Willowcreek Ct Unit 19
- 551 Willowcreek Ct Unit 418
- 589 Willowcreek Ct Unit 25