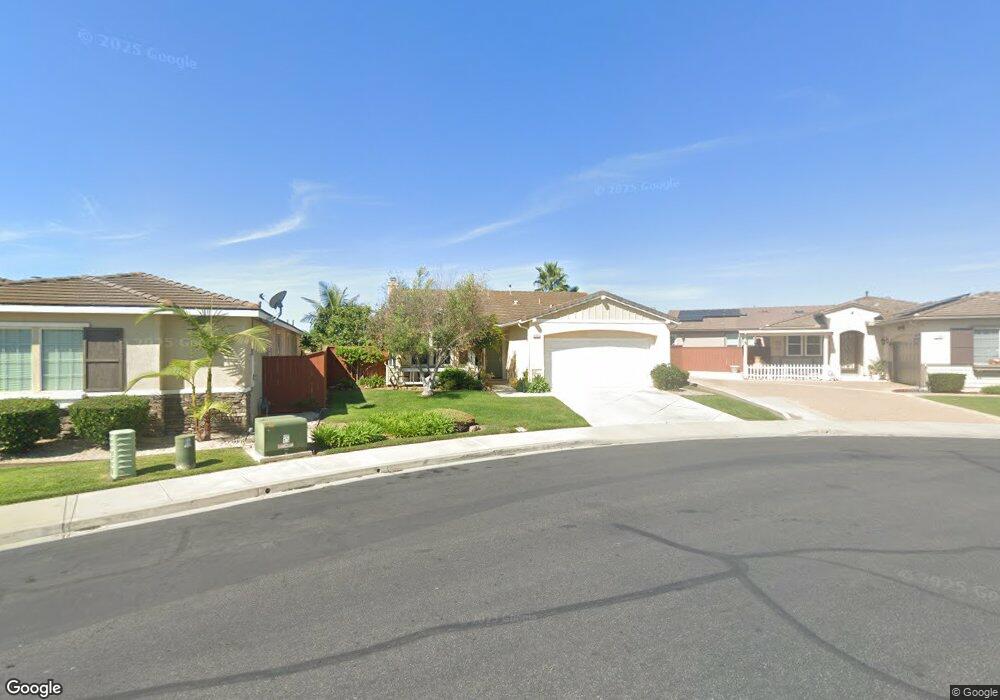
5151 Cobalt Way Oceanside, CA 92057
North Valley NeighborhoodEstimated Value: $880,641 - $1,015,000
3
Beds
2
Baths
1,682
Sq Ft
$556/Sq Ft
Est. Value
About This Home
This home is located at 5151 Cobalt Way, Oceanside, CA 92057 and is currently estimated at $934,410, approximately $555 per square foot. 5151 Cobalt Way is a home located in San Diego County with nearby schools including Reynolds Elementary School, Cesar Chavez Middle School, and El Camino High School.
Ownership History
Date
Name
Owned For
Owner Type
Purchase Details
Closed on
Nov 6, 2014
Sold by
Ryan Gloria Jean and Ryan Denis Joseph
Bought by
Ryan Denis J and Living Gloria Ryan Joint
Current Estimated Value
Purchase Details
Closed on
May 1, 2013
Sold by
Ronalds Christopher and Ronalds Andrea
Bought by
Ryan Gloria Jean and Ryan Denis Joseph
Home Financials for this Owner
Home Financials are based on the most recent Mortgage that was taken out on this home.
Original Mortgage
$110,000
Outstanding Balance
$77,701
Interest Rate
3.41%
Mortgage Type
New Conventional
Estimated Equity
$856,709
Purchase Details
Closed on
Jul 17, 2003
Sold by
Beazer Homes Holdings Corp
Bought by
Ronalds Christopher and Ronalds Andrea
Home Financials for this Owner
Home Financials are based on the most recent Mortgage that was taken out on this home.
Original Mortgage
$38,900
Interest Rate
5.6%
Mortgage Type
Credit Line Revolving
Create a Home Valuation Report for This Property
The Home Valuation Report is an in-depth analysis detailing your home's value as well as a comparison with similar homes in the area
Home Values in the Area
Average Home Value in this Area
Purchase History
| Date | Buyer | Sale Price | Title Company |
|---|---|---|---|
| Ryan Denis J | -- | None Available | |
| Ryan Gloria Jean | $410,000 | Western Resources Title Co | |
| Ronalds Christopher | $390,000 | Fidelity National Title Co |
Source: Public Records
Mortgage History
| Date | Status | Borrower | Loan Amount |
|---|---|---|---|
| Open | Ryan Gloria Jean | $110,000 | |
| Previous Owner | Ronalds Christopher | $38,900 | |
| Previous Owner | Ronalds Christopher | $311,450 |
Source: Public Records
Tax History
| Year | Tax Paid | Tax Assessment Tax Assessment Total Assessment is a certain percentage of the fair market value that is determined by local assessors to be the total taxable value of land and additions on the property. | Land | Improvement |
|---|---|---|---|---|
| 2025 | $5,592 | $509,119 | $291,636 | $217,483 |
| 2024 | $5,592 | $499,137 | $285,918 | $213,219 |
| 2023 | $5,418 | $489,351 | $280,312 | $209,039 |
| 2022 | $5,332 | $479,757 | $274,816 | $204,941 |
| 2021 | $5,304 | $466,429 | $269,428 | $197,001 |
| 2020 | $5,139 | $461,647 | $266,666 | $194,981 |
| 2019 | $4,989 | $452,596 | $261,438 | $191,158 |
| 2018 | $4,934 | $443,722 | $256,312 | $187,410 |
| 2017 | $4,842 | $435,023 | $251,287 | $183,736 |
| 2016 | $4,683 | $426,494 | $246,360 | $180,134 |
| 2015 | $4,546 | $420,089 | $242,660 | $177,429 |
| 2014 | $4,369 | $411,861 | $237,907 | $173,954 |
Source: Public Records
Map
Nearby Homes
- 1113 Teal Way
- 1486 Puritan Way
- 1479 Puritan Dr
- 1438 Salem Ct
- 1039 Eliot St
- 5168 Indian Ct
- 1061 Boulder Place
- 5164 Indian Ct
- 5116 Weymouth Way
- 5450 Alexandrine Ct
- 1359 Corte Alveo
- 924 Glendora Dr
- 1241 Breakaway Dr
- 1120 Championship Rd
- 868 Panella Ct
- 671 Parker St
- 656 Parker St
- 663 Charles Dr
- 569 Gold Dr
- 0 Wilshire Rd
- 5155 Cobalt Way
- 5159 Cobalt Way
- 1143 Prussian Way
- 5287 Weymouth Way
- 5150 Cobalt Way
- 1147 Prussian Way
- 5154 Cobalt Way
- 1123 Azul Ct
- 1487 Plymouth St
- 5158 Cobalt Way
- 5283 Weymouth Way
- 1119 Azul Ct
- 1151 Prussian Way
- 1483 Plymouth St
- 5280 Weymouth Way
- 5153 Cerulean Way
- 5162 Cobalt Way
- 1488 Medford St
- 5279 Weymouth Way
- 1115 Azul Ct
Your Personal Tour Guide
Ask me questions while you tour the home.