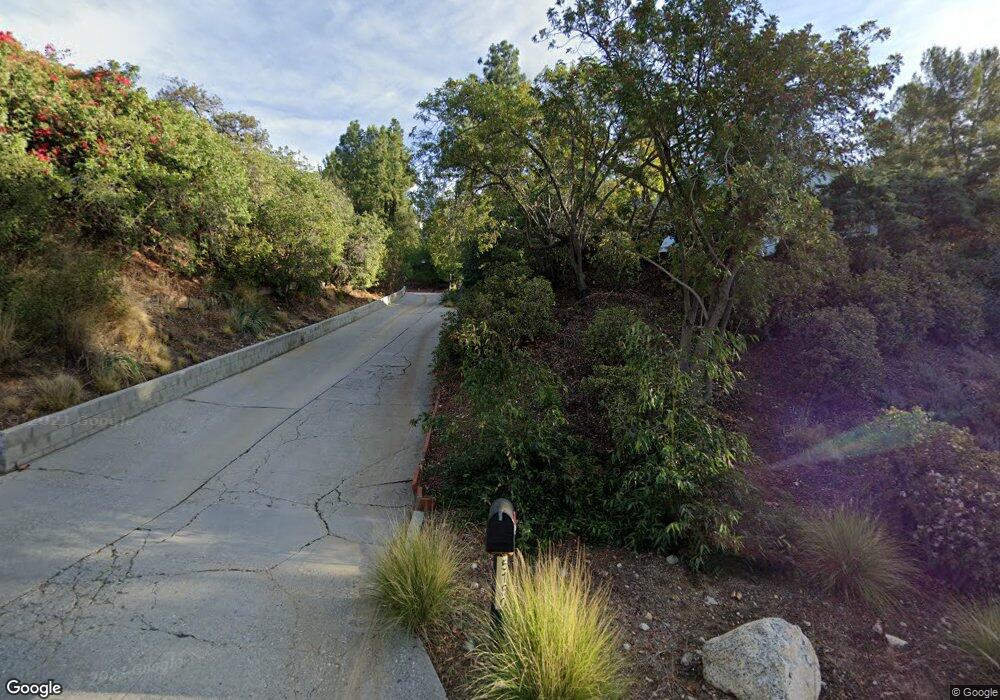
5152 Redwillow Ln La Canada Flintridge, CA 91011
Estimated Value: $2,073,000 - $2,268,000
3
Beds
2
Baths
1,926
Sq Ft
$1,141/Sq Ft
Est. Value
About This Home
This home is located at 5152 Redwillow Ln, La Canada Flintridge, CA 91011 and is currently estimated at $2,197,253, approximately $1,140 per square foot. 5152 Redwillow Ln is a home located in Los Angeles County with nearby schools including Paradise Canyon Elementary School, La Canada High School, and La Canada Preparatory School.
Ownership History
Date
Name
Owned For
Owner Type
Purchase Details
Closed on
Jul 10, 2006
Sold by
Himathongkham Vara and The Vara Himathongkham Revocab
Bought by
Torres Ismael C and Torres Amanda
Current Estimated Value
Home Financials for this Owner
Home Financials are based on the most recent Mortgage that was taken out on this home.
Original Mortgage
$650,000
Outstanding Balance
$406,138
Interest Rate
7.62%
Mortgage Type
New Conventional
Estimated Equity
$1,791,115
Purchase Details
Closed on
Jul 31, 1999
Sold by
Himathongkham Varaporn and Himathongkham Vara
Bought by
Himathongkham Vara and Vara Himathongkham Revocable L
Purchase Details
Closed on
Jan 23, 1998
Sold by
Lertvichuhath Sutham
Bought by
Himathongkham Varaporn
Home Financials for this Owner
Home Financials are based on the most recent Mortgage that was taken out on this home.
Original Mortgage
$275,190
Interest Rate
7.05%
Create a Home Valuation Report for This Property
The Home Valuation Report is an in-depth analysis detailing your home's value as well as a comparison with similar homes in the area
Home Values in the Area
Average Home Value in this Area
Purchase History
| Date | Buyer | Sale Price | Title Company |
|---|---|---|---|
| Torres Ismael C | $915,000 | Gateway Title Company | |
| Himathongkham Vara | -- | -- | |
| Himathongkham Varaporn | -- | Stewart Title |
Source: Public Records
Mortgage History
| Date | Status | Borrower | Loan Amount |
|---|---|---|---|
| Open | Torres Ismael C | $650,000 | |
| Previous Owner | Himathongkham Varaporn | $275,190 |
Source: Public Records
Tax History Compared to Growth
Tax History
| Year | Tax Paid | Tax Assessment Tax Assessment Total Assessment is a certain percentage of the fair market value that is determined by local assessors to be the total taxable value of land and additions on the property. | Land | Improvement |
|---|---|---|---|---|
| 2025 | $14,176 | $1,225,891 | $1,097,282 | $128,609 |
| 2024 | $14,176 | $1,201,855 | $1,075,767 | $126,088 |
| 2023 | $13,787 | $1,178,290 | $1,054,674 | $123,616 |
| 2022 | $13,290 | $1,155,188 | $1,033,995 | $121,193 |
| 2021 | $13,184 | $1,132,538 | $1,013,721 | $118,817 |
| 2019 | $12,789 | $1,098,948 | $983,654 | $115,294 |
| 2018 | $12,468 | $1,077,401 | $964,367 | $113,034 |
| 2016 | $12,599 | $1,035,566 | $926,920 | $108,646 |
| 2015 | $12,435 | $1,020,012 | $912,997 | $107,015 |
| 2014 | $12,277 | $1,000,032 | $895,113 | $104,919 |
Source: Public Records
Map
Nearby Homes
- 5311 Pali Point Ln
- 5419 Godbey Dr
- 5213 Diamond Point Rd
- 4826 Indianola Way
- 5117 Stoneglen Rd
- 4537 Indianola Way
- 4544 Daleridge Rd
- 4156 Aralia Rd
- 4031 Canyon Dell Dr
- 4369 El Prieto Rd
- 909 Coral Way
- 4428 Oakwood Ave
- 848 Greenridge Dr
- 500 Georgian Rd
- 4367 Rising Hill Rd
- 4380 Canyon Crest Rd
- 5805 Briartree Dr
- 4825 Angeles Crest Hwy
- 3740 Canyon Crest Rd
- 4901 Angeles Crest Cir
- 5154 Redwillow Ln
- 5303 Ivafern Ln
- 5164 Redwillow Ln
- 5160 Redwillow Ln
- 5302 Ivafern Ln
- 5156 Redwillow Ln
- 5148 Redwillow Ln
- 5170 Redwillow Ln
- 544 Meadowview Dr
- 5309 Ivafern Ln
- 5304 Ivafern Ln
- 5144 Redwillow Ln
- 536 Meadowview Dr
- 550 Meadowview Dr
- 5311 Ivafern Ln
- 5314 Ivafern Ln
- 5212 Redwillow Ln
- 5140 Redwillow Ln
- 5157 Redwillow Ln
- 528 Meadowview Dr