5153 N 275 E Crawfordsville, IN 47933
Estimated Value: $185,633 - $202,000
3
Beds
1
Bath
1,152
Sq Ft
$168/Sq Ft
Est. Value
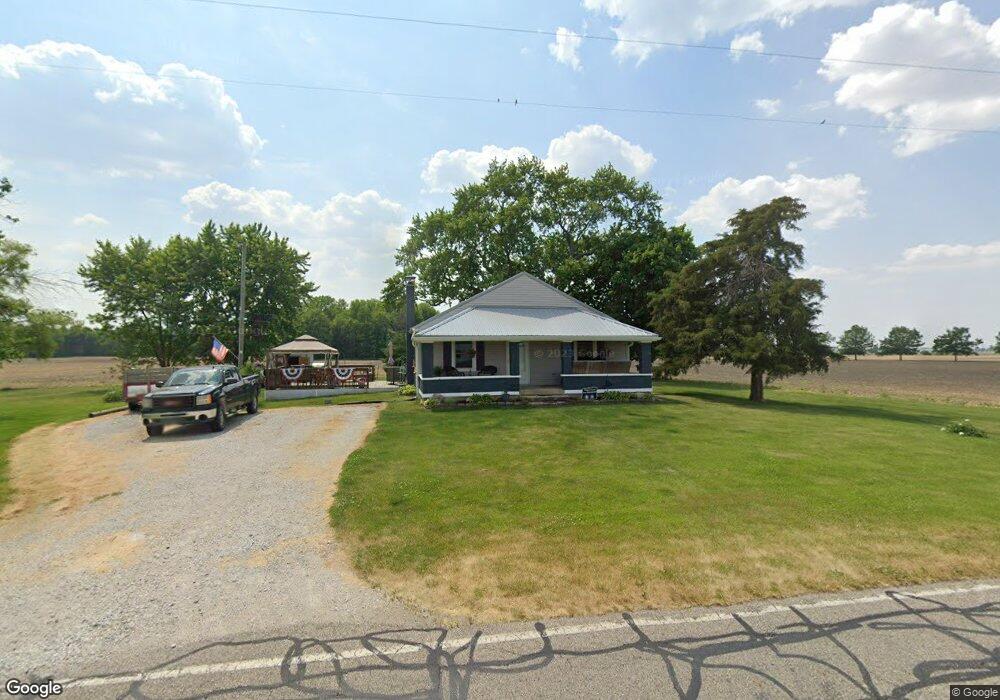
About This Home
This home is located at 5153 N 275 E, Crawfordsville, IN 47933 and is currently estimated at $193,408, approximately $167 per square foot. 5153 N 275 E is a home located in Montgomery County with nearby schools including North Montgomery High School.
Ownership History
Date
Name
Owned For
Owner Type
Purchase Details
Closed on
Feb 9, 2021
Sold by
Denbo Joseph S and Denbo Leah
Bought by
Denbo Joseph S and Denbo Leah L
Current Estimated Value
Home Financials for this Owner
Home Financials are based on the most recent Mortgage that was taken out on this home.
Original Mortgage
$75,000
Outstanding Balance
$55,209
Interest Rate
2.7%
Mortgage Type
New Conventional
Estimated Equity
$138,199
Purchase Details
Closed on
Mar 31, 2006
Sold by
Denbo Joseplh S
Bought by
Denbo Joseph S and Craft Leah
Home Financials for this Owner
Home Financials are based on the most recent Mortgage that was taken out on this home.
Original Mortgage
$27,550
Interest Rate
6.33%
Mortgage Type
Stand Alone Second
Create a Home Valuation Report for This Property
The Home Valuation Report is an in-depth analysis detailing your home's value as well as a comparison with similar homes in the area
Home Values in the Area
Average Home Value in this Area
Purchase History
| Date | Buyer | Sale Price | Title Company |
|---|---|---|---|
| Denbo Joseph S | -- | Partners Title Group Inc | |
| Denbo Joseph S | -- | None Available |
Source: Public Records
Mortgage History
| Date | Status | Borrower | Loan Amount |
|---|---|---|---|
| Open | Denbo Joseph S | $75,000 | |
| Closed | Denbo Joseph S | $27,550 |
Source: Public Records
Tax History Compared to Growth
Tax History
| Year | Tax Paid | Tax Assessment Tax Assessment Total Assessment is a certain percentage of the fair market value that is determined by local assessors to be the total taxable value of land and additions on the property. | Land | Improvement |
|---|---|---|---|---|
| 2024 | $572 | $136,900 | $47,400 | $89,500 |
| 2023 | $442 | $117,700 | $28,600 | $89,100 |
| 2022 | $523 | $120,600 | $28,600 | $92,000 |
| 2021 | $413 | $102,900 | $28,600 | $74,300 |
| 2020 | $357 | $100,100 | $28,600 | $71,500 |
| 2019 | $225 | $79,100 | $28,600 | $50,500 |
| 2018 | $173 | $73,900 | $27,200 | $46,700 |
| 2017 | $166 | $73,200 | $27,200 | $46,000 |
| 2016 | $76 | $70,900 | $27,200 | $43,700 |
| 2014 | $89 | $82,100 | $27,200 | $54,900 |
| 2013 | $89 | $80,100 | $27,200 | $52,900 |
Source: Public Records
Map
Nearby Homes