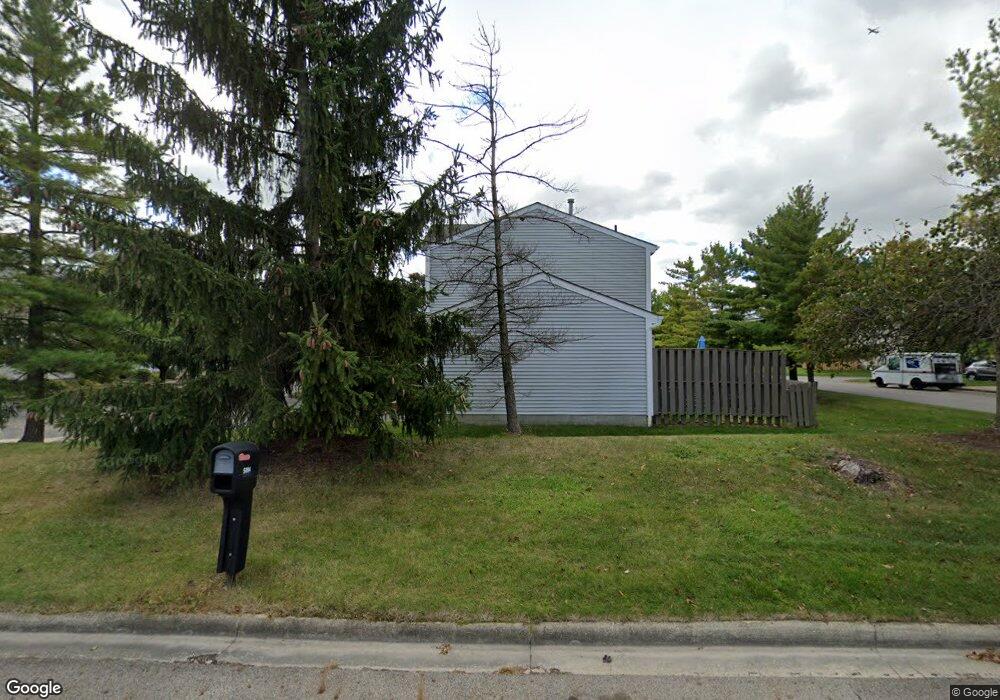
5153 Singleton Dr Hilliard, OH 43026
Cross Creek NeighborhoodEstimated Value: $187,000 - $206,000
2
Beds
2
Baths
839
Sq Ft
$232/Sq Ft
Est. Value
About This Home
This home is located at 5153 Singleton Dr, Hilliard, OH 43026 and is currently estimated at $194,359, approximately $231 per square foot. 5153 Singleton Dr is a home located in Franklin County with nearby schools including Hilliard Crossing Elementary School, Hilliard Station Sixth Grade Elementary School, and Hilliard Heritage Middle School.
Ownership History
Date
Name
Owned For
Owner Type
Purchase Details
Closed on
Jul 31, 2025
Sold by
Sherman Amy Lynn and Stires Amy
Bought by
Richardson Kody
Current Estimated Value
Home Financials for this Owner
Home Financials are based on the most recent Mortgage that was taken out on this home.
Original Mortgage
$186,240
Interest Rate
6.63%
Mortgage Type
New Conventional
Purchase Details
Closed on
Dec 16, 2021
Sold by
Stires Tyler A and Stires Amy
Bought by
Stires Amy
Home Financials for this Owner
Home Financials are based on the most recent Mortgage that was taken out on this home.
Original Mortgage
$110,293
Interest Rate
2.39%
Mortgage Type
New Conventional
Purchase Details
Closed on
Jan 21, 2016
Sold by
Beqachy Donna J and Orr Pamela J
Bought by
Stires Tyler A
Home Financials for this Owner
Home Financials are based on the most recent Mortgage that was taken out on this home.
Original Mortgage
$67,415
Interest Rate
3.97%
Mortgage Type
New Conventional
Purchase Details
Closed on
Aug 22, 1995
Sold by
Mclain James J
Bought by
Alvin E Beachy & Donna J Beachy Trustee
Purchase Details
Closed on
Sep 5, 1991
Create a Home Valuation Report for This Property
The Home Valuation Report is an in-depth analysis detailing your home's value as well as a comparison with similar homes in the area
Home Values in the Area
Average Home Value in this Area
Purchase History
| Date | Buyer | Sale Price | Title Company |
|---|---|---|---|
| Richardson Kody | $192,000 | Superior Title & Escrow | |
| Stires Amy | $120,000 | Amrock Inc | |
| Stires Tyler A | $69,500 | Associated Title | |
| Alvin E Beachy & Donna J Beachy Trustee | $53,350 | -- | |
| -- | $48,700 | -- |
Source: Public Records
Mortgage History
| Date | Status | Borrower | Loan Amount |
|---|---|---|---|
| Previous Owner | Richardson Kody | $186,240 | |
| Previous Owner | Stires Amy | $110,293 | |
| Previous Owner | Stires Tyler A | $67,415 |
Source: Public Records
Tax History
| Year | Tax Paid | Tax Assessment Tax Assessment Total Assessment is a certain percentage of the fair market value that is determined by local assessors to be the total taxable value of land and additions on the property. | Land | Improvement |
|---|---|---|---|---|
| 2025 | $2,702 | $47,850 | $9,800 | $38,050 |
| 2024 | $2,702 | $47,850 | $9,800 | $38,050 |
| 2023 | $2,341 | $47,850 | $9,800 | $38,050 |
| 2022 | $2,432 | $39,800 | $4,590 | $35,210 |
| 2021 | $2,430 | $39,800 | $4,590 | $35,210 |
| 2020 | $2,423 | $39,800 | $4,590 | $35,210 |
| 2019 | $1,956 | $27,440 | $3,150 | $24,290 |
| 2018 | $1,781 | $27,440 | $3,150 | $24,290 |
| 2017 | $1,879 | $27,440 | $3,150 | $24,290 |
| 2016 | $1,810 | $23,000 | $3,080 | $19,920 |
| 2015 | $1,657 | $23,000 | $3,080 | $19,920 |
| 2014 | $1,703 | $23,000 | $3,080 | $19,920 |
| 2013 | $958 | $25,550 | $3,430 | $22,120 |
Source: Public Records
Map
Nearby Homes
- 5160 Singleton Dr Unit 43D
- 5066 Ivywild Ave
- 5083 Singleton Dr Unit 33b
- 2759 Lyndley Ct
- 5176 Skytrail Dr
- 5380 Carjan Way
- 5052 Bressler Dr
- 2962 Carlsbad Dr
- 5285 Redlands Dr
- 2505 Roberts Ct
- 4771 Perlman St Unit 14
- 5138 Roberts Rd
- 4923 Stoneybrook Blvd Unit 21F
- 5288 Hyde Park Dr
- 2477 Crystal Springs Dr
- 2921 Mondavi Ln
- 2385 Yagger Bay Dr
- 2464 Meadow Glade Dr Unit 2464
- 4920 Meadow Run Dr Unit 4920
- 3127 Stouenburgh Dr
- 5151 Singleton Dr Unit 44A
- 5155 Singleton Dr Unit 44C
- 5157 Singleton Dr Unit 44D
- 5137 Singleton Dr
- 5131 Singleton Dr Unit 42A
- 5135 Singleton Dr Unit 42C
- 5147 Singleton Dr
- 5145 Singleton Dr
- 5143 Singleton Dr Unit 40B
- 5133 Singleton Dr Unit 42B
- 5141 Singleton Dr
- 5401 Singleton Dr
- 5166 Singleton Dr Unit 43A
- 5163 Singleton Dr Unit 46B
- 5164 Singleton Dr Unit 43B
- 5171 Singleton Dr Unit 45A
- 5165 Singleton Dr
- 5165 Singleton Dr Unit 46C
- 5167 Singleton Dr Unit 46D
- 5117 Singleton Dr Unit 39D
Your Personal Tour Guide
Ask me questions while you tour the home.