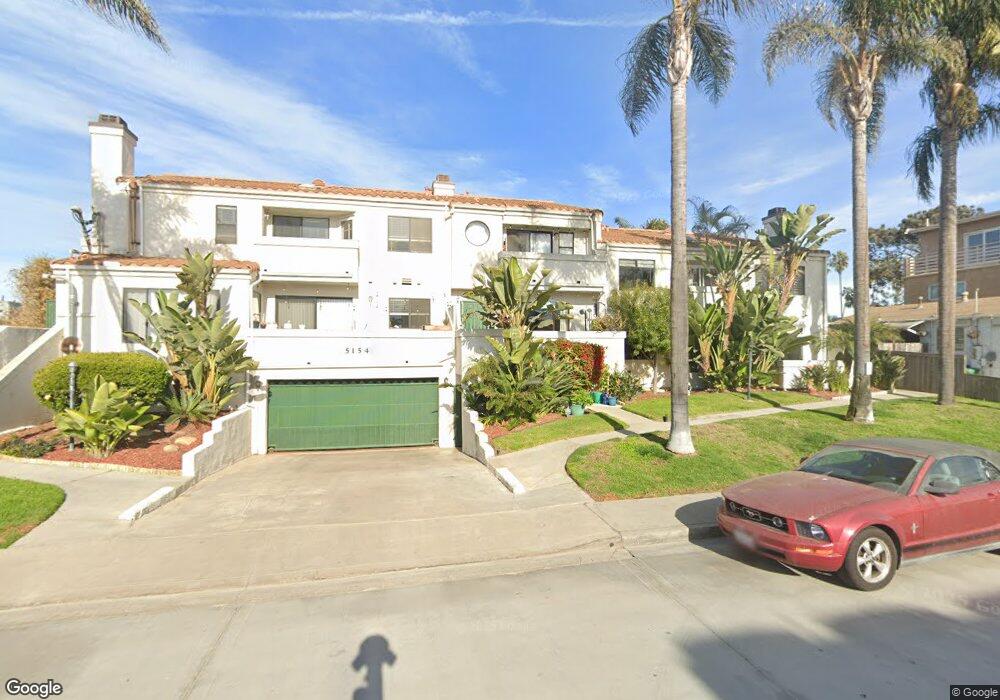
5154 Long Branch Ave Unit C San Diego, CA 92107
Ocean Beach NeighborhoodEstimated Value: $821,000 - $1,052,452
2
Beds
3
Baths
1,221
Sq Ft
$808/Sq Ft
Est. Value
About This Home
This home is located at 5154 Long Branch Ave Unit C, San Diego, CA 92107 and is currently estimated at $986,613, approximately $808 per square foot. 5154 Long Branch Ave Unit C is a home located in San Diego County with nearby schools including Ocean Beach Elementary School, Richard Henry Dana Middle School, and Correia Middle School.
Ownership History
Date
Name
Owned For
Owner Type
Purchase Details
Closed on
Apr 19, 1999
Sold by
United Commerce Company
Bought by
Duncan Shannon June
Current Estimated Value
Home Financials for this Owner
Home Financials are based on the most recent Mortgage that was taken out on this home.
Original Mortgage
$206,150
Outstanding Balance
$51,940
Interest Rate
6.98%
Estimated Equity
$934,673
Purchase Details
Closed on
Feb 17, 1999
Sold by
Jon Grollo and Robinson Mitchell A
Bought by
United Commerce Company
Purchase Details
Closed on
Mar 31, 1994
Sold by
Foreman Grollo Karen B
Bought by
Grollo Jon
Purchase Details
Closed on
Jul 16, 1990
Purchase Details
Closed on
May 27, 1988
Create a Home Valuation Report for This Property
The Home Valuation Report is an in-depth analysis detailing your home's value as well as a comparison with similar homes in the area
Home Values in the Area
Average Home Value in this Area
Purchase History
| Date | Buyer | Sale Price | Title Company |
|---|---|---|---|
| Duncan Shannon June | $217,000 | Commonwealth Land Title Co | |
| United Commerce Company | $170,983 | Commonwealth Land Title Co | |
| Grollo Jon | -- | Southland Title Corporation | |
| -- | $192,500 | -- | |
| -- | $175,900 | -- |
Source: Public Records
Mortgage History
| Date | Status | Borrower | Loan Amount |
|---|---|---|---|
| Open | Duncan Shannon June | $206,150 |
Source: Public Records
Tax History Compared to Growth
Tax History
| Year | Tax Paid | Tax Assessment Tax Assessment Total Assessment is a certain percentage of the fair market value that is determined by local assessors to be the total taxable value of land and additions on the property. | Land | Improvement |
|---|---|---|---|---|
| 2025 | $4,041 | $340,163 | $172,433 | $167,730 |
| 2024 | $4,041 | $333,494 | $169,052 | $164,442 |
| 2023 | $3,951 | $326,956 | $165,738 | $161,218 |
| 2022 | $3,844 | $320,546 | $162,489 | $158,057 |
| 2021 | $3,816 | $314,261 | $159,303 | $154,958 |
| 2020 | $3,770 | $311,040 | $157,670 | $153,370 |
| 2019 | $3,701 | $304,942 | $154,579 | $150,363 |
| 2018 | $3,459 | $298,964 | $151,549 | $147,415 |
| 2017 | $3,376 | $293,103 | $148,578 | $144,525 |
| 2016 | $3,320 | $287,357 | $145,665 | $141,692 |
| 2015 | $3,270 | $283,041 | $143,477 | $139,564 |
| 2014 | $3,218 | $277,498 | $140,667 | $136,831 |
Source: Public Records
Map
Nearby Homes
- 5038-40 W Point Loma Blvd
- 5036 W Point Loma Blvd
- 4922 Muir Ave
- 5035 Saratoga Ave
- 1975 Bacon St
- 2617 Ocean Front Walk
- 2623 Ocean Front Walk
- 2632 Bayside Walk
- 4985 Narragansett Ave Unit 87
- 4674 Saratoga Ave Unit 2
- 814 San Luis Rey Place Unit 16
- 818 San Luis Rey Place Unit 20
- 1817-19 Sunset Cliffs Blvd
- 2735 Mission Blvd
- 2727 Ocean Front Walk Unit 3
- 2741 Bayside Walk
- 4614 Larkspur St
- 2740 Ocean Front Walk
- 2226 Etiwanda St
- 4985 Coronado Ave Unit 2
- 5154 Long Branch Ave Unit E
- 5154 Long Branch Ave Unit D
- 5154 Long Branch Ave Unit B
- 5154 Long Branch Ave Unit A
- 5144 Long Branch Ave Unit 46
- 5162 Long Branch Ave Unit 64
- 5140 Long Branch Ave
- 5178 Long Branch Ave
- 5182 Long Branch Ave
- 5180 Long Branch Ave
- 5157 Muir Ave Unit 59
- 5153 Muir Ave
- 5155 Muir Ave
- 5170 Long Branch Ave Unit 74
- 5161 Muir Ave Unit 63
- 5165 Muir Ave Unit 67
- 5134 Long Branch Ave Unit 36
- 5141 Muir Ave
- 5143 Long Branch Ave Unit 47
- 5157 Long Branch Ave Unit 4