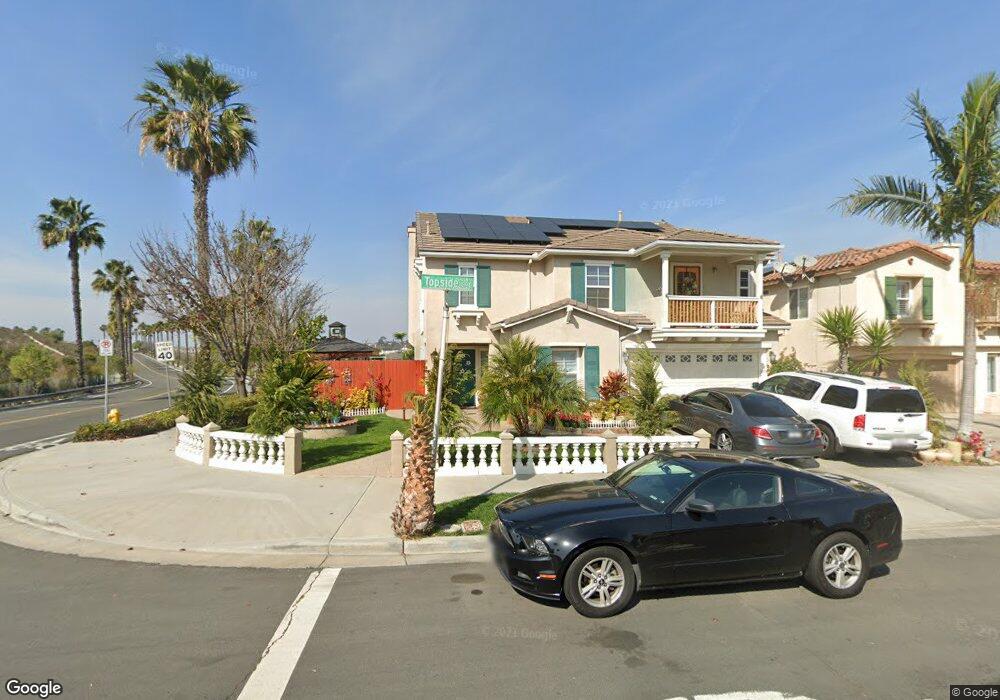
5154 Topside Ln Unit 3B San Diego, CA 92154
Ocean View Hills NeighborhoodEstimated Value: $1,056,000 - $1,164,000
5
Beds
3
Baths
2,859
Sq Ft
$390/Sq Ft
Est. Value
About This Home
This home is located at 5154 Topside Ln Unit 3B, San Diego, CA 92154 and is currently estimated at $1,115,019, approximately $390 per square foot. 5154 Topside Ln Unit 3B is a home located in San Diego County with nearby schools including Juarez Lincoln Elementary School, Montgomery Middle School, and Montgomery Senior High School.
Ownership History
Date
Name
Owned For
Owner Type
Purchase Details
Closed on
Apr 7, 2017
Sold by
Para Jeffrey and Para Terri
Bought by
Pollante Noel R and Pollante Edelmira V
Current Estimated Value
Home Financials for this Owner
Home Financials are based on the most recent Mortgage that was taken out on this home.
Original Mortgage
$608,760
Interest Rate
4.21%
Mortgage Type
FHA
Purchase Details
Closed on
Jun 21, 2016
Sold by
Pardee Homes
Bought by
Parkview At Dennery Ranch Community Asso
Purchase Details
Closed on
May 30, 2003
Sold by
Pardee Homes
Bought by
Para Jeffrey and Para Terri
Home Financials for this Owner
Home Financials are based on the most recent Mortgage that was taken out on this home.
Original Mortgage
$372,469
Interest Rate
5.61%
Mortgage Type
Unknown
Create a Home Valuation Report for This Property
The Home Valuation Report is an in-depth analysis detailing your home's value as well as a comparison with similar homes in the area
Home Values in the Area
Average Home Value in this Area
Purchase History
| Date | Buyer | Sale Price | Title Company |
|---|---|---|---|
| Pollante Noel R | $620,000 | Corinthian Title | |
| Parkview At Dennery Ranch Community Asso | -- | First American Title | |
| Parkview At Dennery Ranch Community Asso | -- | First American Title | |
| Parkview At Dennery Ranch Community Asso | -- | First American Title | |
| Para Jeffrey | $466,000 | First American Title Co |
Source: Public Records
Mortgage History
| Date | Status | Borrower | Loan Amount |
|---|---|---|---|
| Previous Owner | Pollante Noel R | $608,760 | |
| Previous Owner | Para Jeffrey | $372,469 | |
| Closed | Para Jeffrey | $46,558 |
Source: Public Records
Tax History Compared to Growth
Tax History
| Year | Tax Paid | Tax Assessment Tax Assessment Total Assessment is a certain percentage of the fair market value that is determined by local assessors to be the total taxable value of land and additions on the property. | Land | Improvement |
|---|---|---|---|---|
| 2025 | $10,581 | $719,542 | $200,944 | $518,598 |
| 2024 | $10,581 | $705,434 | $197,004 | $508,430 |
| 2023 | $10,382 | $691,603 | $193,142 | $498,461 |
| 2022 | $10,052 | $678,043 | $189,355 | $488,688 |
| 2021 | $9,806 | $664,749 | $185,643 | $479,106 |
| 2020 | $9,561 | $657,934 | $183,740 | $474,194 |
| 2019 | $9,295 | $645,035 | $180,138 | $464,897 |
| 2018 | $9,131 | $632,388 | $176,606 | $455,782 |
| 2017 | $8,469 | $580,883 | $162,223 | $418,660 |
| 2016 | $8,018 | $550,000 | $151,000 | $399,000 |
| 2015 | $7,603 | $515,000 | $142,000 | $373,000 |
| 2014 | $6,656 | $430,000 | $119,000 | $311,000 |
Source: Public Records
Map
Nearby Homes
- 5270 Topsail Dr
- 5353 Topsail Dr
- 848 Makani St Unit 2
- 477 Vista San Lucas
- 852 Makani St Unit 7
- 782 Anchor Cove
- 5465 Seacliff Place Unit 76
- 5192 Emerald Cove
- 5080 Sea Reef Place
- 1648 Pescadero Point Ct
- 5317 Westport View Dr
- 690 False Point Ct
- 1210 Jade Cove Ct
- 1155 Ariat St Unit 2
- Anden 3 Plan at Anden at Escaya
- Anden 3X Plan at Anden at Escaya
- Anden 2 Plan at Anden at Escaya
- Anden 4X Plan at Anden at Escaya
- Anden 4 Plan at Anden at Escaya
- Anden 1 Plan at Anden at Escaya
- 5158 Topside Ln
- 5161 Topside Ln
- 5166 Topside Ln
- 5153 Topside Ln
- 5175 Topside Ln
- 5170 Topside Ln
- 5176 Topside Ln
- 5185 Topside Ln Unit 3B
- 5182 Topside Ln
- 470 Sea Holly Ct Unit 3B
- 464 Sea Holly Ct
- 458 Sea Holly Ct
- 5186 Topside Ln Unit 3B
- 476 Sea Holly Ct
- 5192 Topside Ln
- 5196 Topside Ln
- 481 Sea Holly Ct
- 5205 Topside Ln Unit 3B
- 5202 Topside Ln Unit 3B
- 5204 Topsail Dr