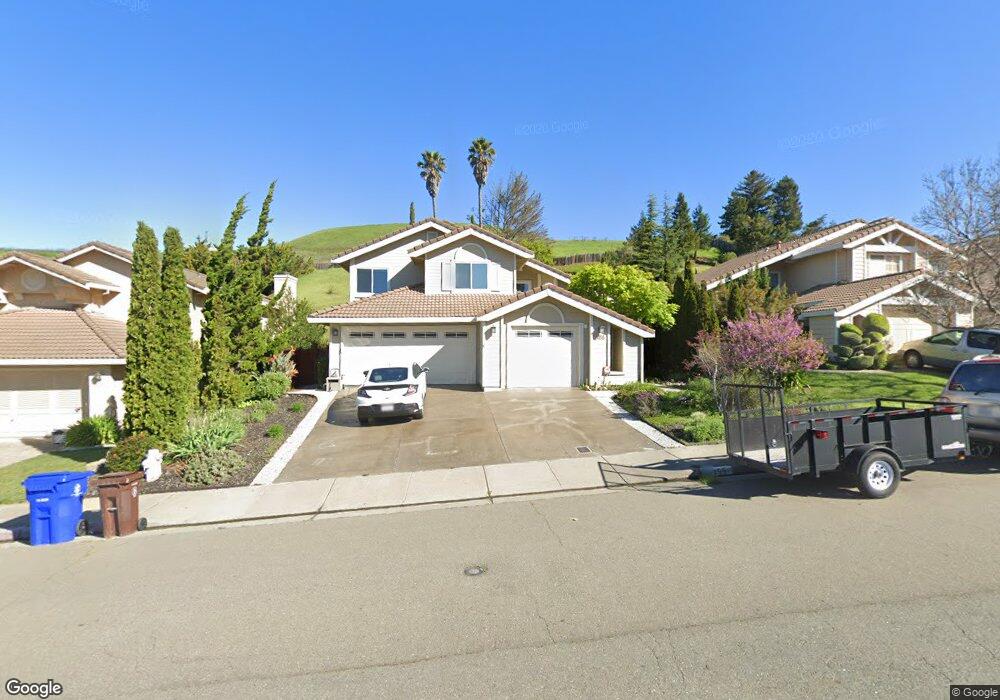
5155 Carriage Dr El Sobrante, CA 94803
Carriage Hills NeighborhoodEstimated Value: $993,000 - $1,054,000
4
Beds
3
Baths
2,483
Sq Ft
$409/Sq Ft
Est. Value
About This Home
This home is located at 5155 Carriage Dr, El Sobrante, CA 94803 and is currently estimated at $1,015,486, approximately $408 per square foot. 5155 Carriage Dr is a home located in Contra Costa County with nearby schools including Olinda Elementary School, Betty Reid Soskin Middle School, and De Anza Senior High School.
Ownership History
Date
Name
Owned For
Owner Type
Purchase Details
Closed on
Jun 11, 2020
Sold by
Cooper Jason Kyle
Bought by
Cooper Jason Kyle and Cooper Alyssa Baldo
Current Estimated Value
Home Financials for this Owner
Home Financials are based on the most recent Mortgage that was taken out on this home.
Original Mortgage
$510,000
Outstanding Balance
$452,076
Interest Rate
3.2%
Mortgage Type
New Conventional
Estimated Equity
$563,410
Purchase Details
Closed on
Jan 25, 2016
Sold by
Magnus Christopher Jens and Cheung Terrance T S
Bought by
Cooper Jason Kyle
Home Financials for this Owner
Home Financials are based on the most recent Mortgage that was taken out on this home.
Original Mortgage
$450,000
Interest Rate
3.94%
Mortgage Type
New Conventional
Purchase Details
Closed on
Jul 1, 2014
Sold by
Magnus Christopher J and Cheung Terrance
Bought by
Magnus Christopher Jens and Cheung Terrance T S
Purchase Details
Closed on
Nov 5, 2013
Sold by
Black Samuel Lord and Black Kathleen Lord
Bought by
Magnus Christopher J and Cheung Terrance
Home Financials for this Owner
Home Financials are based on the most recent Mortgage that was taken out on this home.
Original Mortgage
$400,320
Interest Rate
4.17%
Mortgage Type
New Conventional
Purchase Details
Closed on
Aug 30, 2012
Sold by
Black Samuel Lord and Black Kathleen Lord
Bought by
Black Samuel Lord and Black Kathleen Lord
Home Financials for this Owner
Home Financials are based on the most recent Mortgage that was taken out on this home.
Original Mortgage
$300,000
Interest Rate
3.47%
Mortgage Type
New Conventional
Purchase Details
Closed on
Apr 20, 2010
Sold by
Black Samuel Lord and Black Kathleen Lord
Bought by
The Lord Black Family Trust
Home Financials for this Owner
Home Financials are based on the most recent Mortgage that was taken out on this home.
Original Mortgage
$218,500
Interest Rate
4.97%
Mortgage Type
New Conventional
Purchase Details
Closed on
Feb 23, 2010
Sold by
Black Samuel Lord and Black Samuel
Bought by
Black Samuel Lord and Black Kathleen Lord
Home Financials for this Owner
Home Financials are based on the most recent Mortgage that was taken out on this home.
Original Mortgage
$218,500
Interest Rate
4.97%
Mortgage Type
New Conventional
Purchase Details
Closed on
Apr 16, 1999
Sold by
Thomawong and Sudarat
Bought by
Black Samuel
Home Financials for this Owner
Home Financials are based on the most recent Mortgage that was taken out on this home.
Original Mortgage
$232,000
Interest Rate
6.98%
Mortgage Type
Purchase Money Mortgage
Create a Home Valuation Report for This Property
The Home Valuation Report is an in-depth analysis detailing your home's value as well as a comparison with similar homes in the area
Home Values in the Area
Average Home Value in this Area
Purchase History
| Date | Buyer | Sale Price | Title Company |
|---|---|---|---|
| Cooper Jason Kyle | -- | North American Title | |
| Cooper Jason Kyle | $668,000 | North American Title Co Inc | |
| Magnus Christopher Jens | -- | None Available | |
| Magnus Christopher J | $501,000 | Old Republic Title Company | |
| Black Samuel Lord | -- | First American Title Company | |
| The Lord Black Family Trust | -- | None Available | |
| Black Samuel Lord | -- | First American Title Company | |
| Black Samuel | $290,000 | North American Title Co |
Source: Public Records
Mortgage History
| Date | Status | Borrower | Loan Amount |
|---|---|---|---|
| Open | Cooper Jason Kyle | $510,000 | |
| Closed | Cooper Jason Kyle | $450,000 | |
| Previous Owner | Magnus Christopher J | $400,320 | |
| Previous Owner | Black Samuel Lord | $300,000 | |
| Previous Owner | Black Samuel Lord | $218,500 | |
| Previous Owner | Black Samuel | $232,000 |
Source: Public Records
Tax History Compared to Growth
Tax History
| Year | Tax Paid | Tax Assessment Tax Assessment Total Assessment is a certain percentage of the fair market value that is determined by local assessors to be the total taxable value of land and additions on the property. | Land | Improvement |
|---|---|---|---|---|
| 2025 | $12,255 | $789,939 | $355,136 | $434,803 |
| 2024 | $12,255 | $774,451 | $348,173 | $426,278 |
| 2023 | $12,006 | $759,267 | $341,347 | $417,920 |
| 2022 | $11,847 | $744,380 | $334,654 | $409,726 |
| 2021 | $11,799 | $729,786 | $328,093 | $401,693 |
| 2019 | $11,155 | $708,142 | $318,362 | $389,780 |
| 2018 | $10,763 | $694,258 | $312,120 | $382,138 |
| 2017 | $10,532 | $680,646 | $306,000 | $374,646 |
| 2016 | $8,215 | $518,801 | $199,340 | $319,461 |
| 2015 | $8,188 | $511,009 | $196,346 | $314,663 |
| 2014 | $8,094 | $501,000 | $192,500 | $308,500 |
Source: Public Records
Map
Nearby Homes
- 5378 Conestoga Way
- 5567 Woodview Dr
- 5472 Country View Dr
- 2305 Marlin Ct
- 3950 Pinole Valley Rd
- 2323 Doidge Ave
- 2358 Wright Ave
- 705 Devils Drop Ct
- 5909 Amend Rd
- 2632 Wright Ave
- 3656 Morningside Dr
- 7 Abbie Ln
- 2543 Heide Ct
- 2558 Silvercrest Ct
- 2537 Heide Ct
- 109 Scotts Chute Ct
- 5774 Friar Ct
- 628 Stanley Ln
- 0 Knobcone Unit 41077144
- 3743 Painted Pony Rd
- 5163 Carriage Dr
- 5147 Carriage Dr
- 5171 Carriage Dr
- 5139 Carriage Dr
- 5179 Carriage Dr
- 5131 Carriage Dr
- 5187 Carriage Dr
- 5154 Carriage Dr
- 5160 Carriage Dr
- 5146 Carriage Dr
- 5168 Carriage Dr
- 5140 Carriage Dr
- 5123 Carriage Dr
- 5195 Carriage Dr
- 5176 Carriage Dr
- 5134 Carriage Dr
- 5184 Carriage Dr
- 5201 Carriage Dr
- 5115 Carriage Dr
- 5126 Carriage Dr