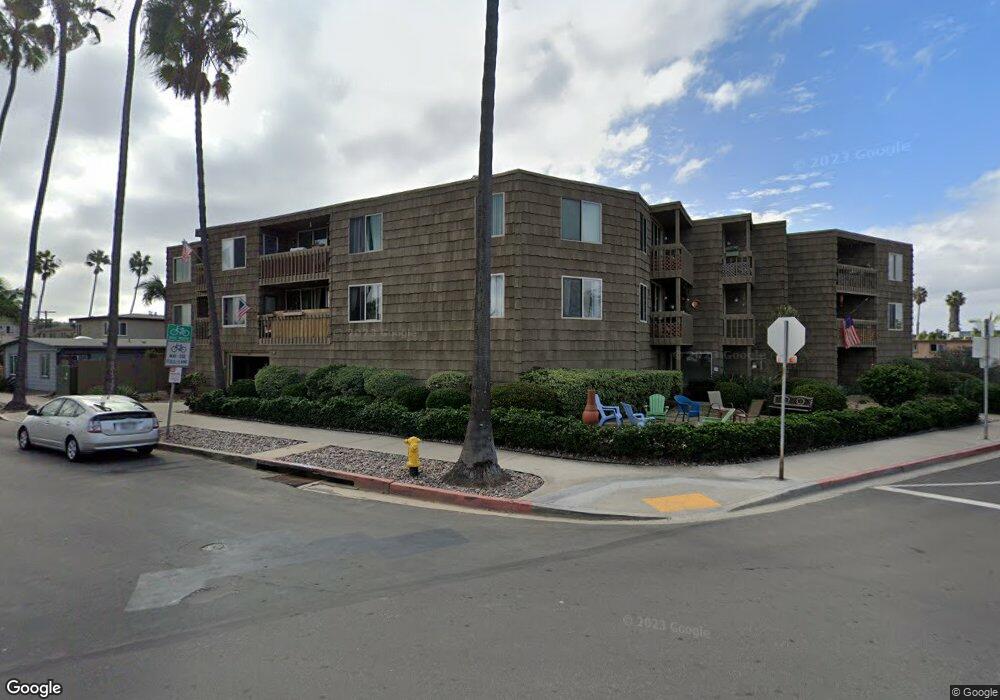
5155 W Point Loma Blvd Unit 4 San Diego, CA 92107
Ocean Beach NeighborhoodEstimated Value: $783,000 - $1,017,000
2
Beds
2
Baths
1,010
Sq Ft
$854/Sq Ft
Est. Value
About This Home
This home is located at 5155 W Point Loma Blvd Unit 4, San Diego, CA 92107 and is currently estimated at $862,914, approximately $854 per square foot. 5155 W Point Loma Blvd Unit 4 is a home located in San Diego County with nearby schools including Ocean Beach Elementary School, Richard Henry Dana Middle School, and Correia Middle School.
Ownership History
Date
Name
Owned For
Owner Type
Purchase Details
Closed on
Aug 28, 2001
Sold by
Escobar Sonia
Bought by
Harges John J
Current Estimated Value
Home Financials for this Owner
Home Financials are based on the most recent Mortgage that was taken out on this home.
Original Mortgage
$97,000
Outstanding Balance
$38,100
Interest Rate
7.09%
Estimated Equity
$824,814
Purchase Details
Closed on
Apr 12, 1995
Sold by
Free Robert Joseph
Bought by
Free Suzanne
Purchase Details
Closed on
Jan 21, 1988
Create a Home Valuation Report for This Property
The Home Valuation Report is an in-depth analysis detailing your home's value as well as a comparison with similar homes in the area
Home Values in the Area
Average Home Value in this Area
Purchase History
| Date | Buyer | Sale Price | Title Company |
|---|---|---|---|
| Harges John J | -- | Fidelity National Title Co | |
| Free Suzanne | -- | -- | |
| Free Suzanne | -- | -- | |
| -- | $110,000 | -- |
Source: Public Records
Mortgage History
| Date | Status | Borrower | Loan Amount |
|---|---|---|---|
| Open | Harges John J | $97,000 |
Source: Public Records
Tax History Compared to Growth
Tax History
| Year | Tax Paid | Tax Assessment Tax Assessment Total Assessment is a certain percentage of the fair market value that is determined by local assessors to be the total taxable value of land and additions on the property. | Land | Improvement |
|---|---|---|---|---|
| 2025 | $2,480 | $210,507 | $86,671 | $123,836 |
| 2024 | $2,480 | $206,380 | $84,972 | $121,408 |
| 2023 | $2,424 | $202,334 | $83,306 | $119,028 |
| 2022 | $2,358 | $198,368 | $81,673 | $116,695 |
| 2021 | $2,340 | $194,479 | $80,072 | $114,407 |
| 2020 | $2,311 | $192,485 | $79,251 | $113,234 |
| 2019 | $2,269 | $188,712 | $77,698 | $111,014 |
| 2018 | $2,121 | $185,013 | $76,175 | $108,838 |
| 2017 | $80 | $181,386 | $74,682 | $106,704 |
| 2016 | $2,034 | $177,830 | $73,218 | $104,612 |
| 2015 | $2,003 | $175,160 | $72,119 | $103,041 |
| 2014 | $1,971 | $171,730 | $70,707 | $101,023 |
Source: Public Records
Map
Nearby Homes
- 5038-40 W Point Loma Blvd
- 5036 W Point Loma Blvd
- 4922 Muir Ave
- 5035 Saratoga Ave
- 4954 Saratoga Ave
- 1975 Bacon St
- 2617 Ocean Front Walk
- 2623 Ocean Front Walk
- 2632 Bayside Walk
- 814 San Luis Rey Place Unit 16
- 818 San Luis Rey Place Unit 20
- 4985 Narragansett Ave Unit 87
- 2735 Mission Blvd
- 4674 Saratoga Ave Unit 2
- 2727 Ocean Front Walk Unit 3
- 2741 Bayside Walk
- 2740 Ocean Front Walk
- 4614 Larkspur St
- 1817-19 Sunset Cliffs Blvd
- 2812 Bayside Walk
- 5155 W Point Loma Blvd
- 5155 W Point Loma Blvd
- 5155 W Point Loma Blvd Unit 6
- 5155 W Point Loma Blvd Unit 5
- 5155 W Point Loma Blvd Unit 3
- 5155 W Point Loma Blvd Unit 2
- 5155 W Point Loma Blvd Unit 1
- 5155 W Point Loma Blvd Unit 14
- 5155 W Point Loma Blvd Unit 13
- 5155 W Point Loma Blvd Unit 12
- 5155 W Point Loma Blvd Unit 11
- 5155 W Point Loma Blvd Unit 10
- 5155 W Point Loma Blvd Unit 8
- 5155 W Point Loma Blvd Unit 7
- 5155 W Pt Loma Ave
- 5155 W Pt Loma Ave Unit 12
- 5129 Voltaire St Unit 35
- 5159 W Point Loma Blvd
- 5150 Muir Ave Unit 52
- 5159 W Point Loma Blvd