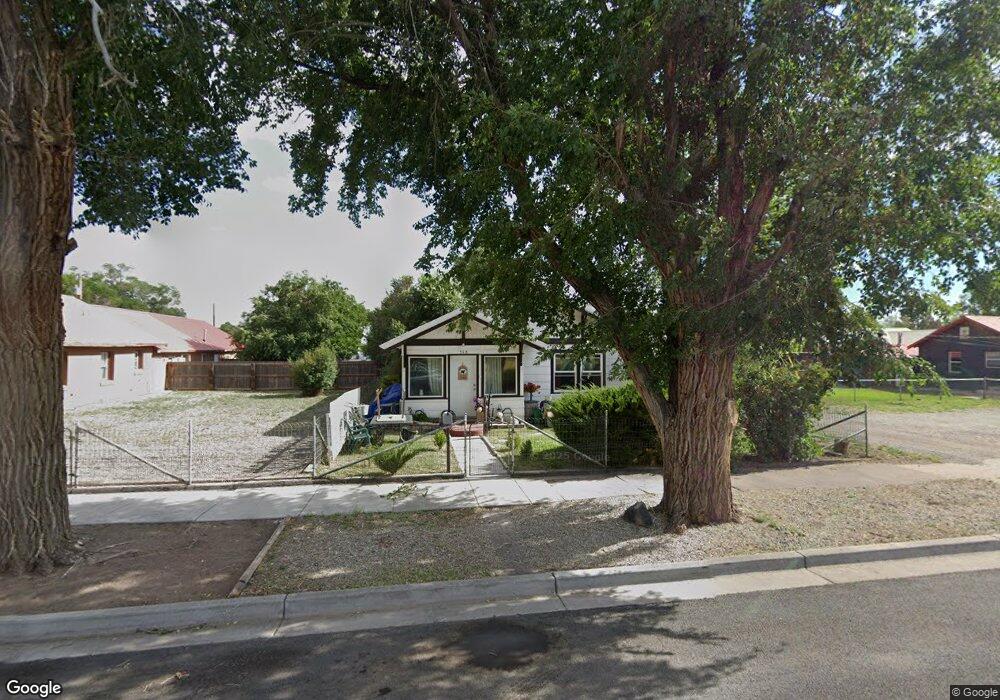
516 12th St Alamosa, CO 81101
Estimated Value: $215,715 - $258,000
3
Beds
1
Bath
1,337
Sq Ft
$171/Sq Ft
Est. Value
About This Home
This home is located at 516 12th St, Alamosa, CO 81101 and is currently estimated at $228,679, approximately $171 per square foot. 516 12th St is a home located in Alamosa County with nearby schools including Alamosa Elementary School, Ortega Middle School, and Alamosa High School.
Ownership History
Date
Name
Owned For
Owner Type
Purchase Details
Closed on
Nov 15, 2017
Sold by
Community Resources And Housing Developm
Bought by
Lang Charles J and Lang Mary L
Current Estimated Value
Home Financials for this Owner
Home Financials are based on the most recent Mortgage that was taken out on this home.
Original Mortgage
$116,716
Interest Rate
3.92%
Mortgage Type
VA
Purchase Details
Closed on
Mar 30, 2012
Sold by
Wells Fargo Bank Na
Bought by
The Secretary Of Hud
Purchase Details
Closed on
Mar 22, 2012
Sold by
Lintott Valerie Dawn and Lintott Christopher Lee
Bought by
Wells Fargo Bank Na
Purchase Details
Closed on
Sep 29, 2000
Sold by
Turney Richard L and Turney Thelma A
Bought by
Lintott Christopher Lee and Lintott Valerie Dawn
Purchase Details
Closed on
Jan 19, 1988
Sold by
Turney Richard L
Bought by
Turney Richard L and Turney Thelma A
Purchase Details
Closed on
Aug 29, 1985
Sold by
Turney Richard
Bought by
Clark Dorothy B
Create a Home Valuation Report for This Property
The Home Valuation Report is an in-depth analysis detailing your home's value as well as a comparison with similar homes in the area
Purchase History
| Date | Buyer | Sale Price | Title Company |
|---|---|---|---|
| Lang Charles J | $119,500 | None Available | |
| The Secretary Of Hud | $86,028 | None Available | |
| Wells Fargo Bank Na | -- | None Available | |
| Lintott Christopher Lee | $87,500 | -- | |
| Turney Richard L | -- | -- | |
| Clark Dorothy B | -- | -- |
Source: Public Records
Mortgage History
| Date | Status | Borrower | Loan Amount |
|---|---|---|---|
| Previous Owner | Lang Charles J | $116,716 |
Source: Public Records
Tax History
| Year | Tax Paid | Tax Assessment Tax Assessment Total Assessment is a certain percentage of the fair market value that is determined by local assessors to be the total taxable value of land and additions on the property. | Land | Improvement |
|---|---|---|---|---|
| 2025 | $1,082 | $13,845 | $750 | $13,095 |
| 2024 | $663 | $12,652 | $804 | $11,848 |
| 2023 | $680 | $12,775 | $812 | $11,963 |
| 2022 | $828 | $10,763 | $558 | $10,205 |
| 2020 | $745 | $10,763 | $558 | $10,205 |
| 2019 | $747 | $9,258 | $558 | $8,700 |
| 2018 | $594 | $7,227 | $562 | $6,665 |
| 2017 | $595 | $7,227 | $562 | $6,665 |
| 2016 | $697 | $8,506 | $621 | $7,885 |
| 2015 | $696 | $8,506 | $621 | $7,885 |
| 2014 | -- | $8,506 | $621 | $7,885 |
| 2013 | -- | $8,506 | $621 | $7,885 |
Source: Public Records
Map
Nearby Homes
- 512 12th St
- 1206 State Ave
- 1202 State Ave
- 1210 State Ave
- 1212 State Ave
- 515 13th St
- 1205 Hunt Ave
- 1201 Hunt Ave
- 1207 Hunt Ave
- 1224 State Ave
- 1211 Hunt Ave
- 1 Princess Ann Place
- 0 Princess Ann Place Unit 687454
- 500 12th St Unit C2
- 1219 Hunt Ave
- 509 12th St
- 1201 State Ave
- 505 12th St Unit A
- 505 12th St
- 603 12th St
Your Personal Tour Guide
Ask me questions while you tour the home.