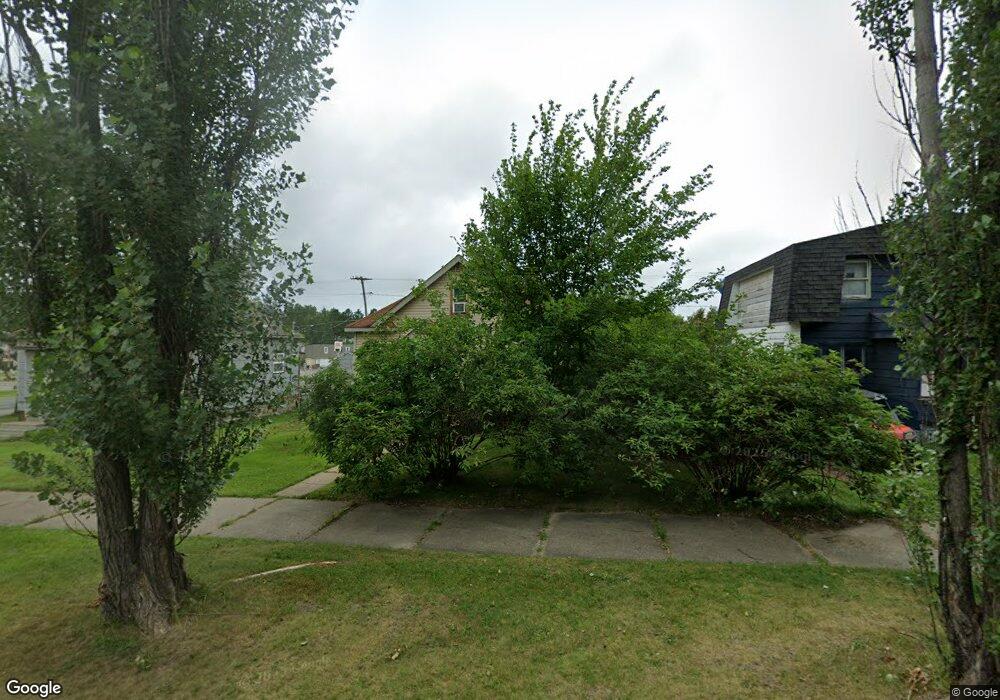
516 4th St SW Chisholm, MN 55719
Estimated Value: $110,000 - $130,000
3
Beds
3
Baths
988
Sq Ft
$121/Sq Ft
Est. Value
About This Home
This home is located at 516 4th St SW, Chisholm, MN 55719 and is currently estimated at $120,010, approximately $121 per square foot. 516 4th St SW is a home located in St. Louis County with nearby schools including Vaughan Elementary School, Chisholm Elementary School, and Chisholm Secondary School.
Ownership History
Date
Name
Owned For
Owner Type
Purchase Details
Closed on
Mar 7, 2024
Sold by
Olson Bonnie L
Bought by
Olson David Roy
Current Estimated Value
Home Financials for this Owner
Home Financials are based on the most recent Mortgage that was taken out on this home.
Original Mortgage
$50,000
Outstanding Balance
$49,163
Interest Rate
6.9%
Mortgage Type
New Conventional
Estimated Equity
$70,847
Purchase Details
Closed on
Apr 28, 2022
Sold by
Olson Bonnie L
Bought by
Olson David
Create a Home Valuation Report for This Property
The Home Valuation Report is an in-depth analysis detailing your home's value as well as a comparison with similar homes in the area
Home Values in the Area
Average Home Value in this Area
Purchase History
| Date | Buyer | Sale Price | Title Company |
|---|---|---|---|
| Olson David Roy | $500 | Northeast Title Company | |
| Olson David | $500 | Simonson Ronald A |
Source: Public Records
Mortgage History
| Date | Status | Borrower | Loan Amount |
|---|---|---|---|
| Open | Olson David Roy | $50,000 |
Source: Public Records
Tax History Compared to Growth
Tax History
| Year | Tax Paid | Tax Assessment Tax Assessment Total Assessment is a certain percentage of the fair market value that is determined by local assessors to be the total taxable value of land and additions on the property. | Land | Improvement |
|---|---|---|---|---|
| 2024 | $264 | $102,700 | $7,200 | $95,500 |
| 2023 | $264 | $97,300 | $7,200 | $90,100 |
| 2022 | $110 | $75,300 | $5,500 | $69,800 |
| 2021 | $120 | $63,300 | $3,300 | $60,000 |
| 2020 | $114 | $63,300 | $3,300 | $60,000 |
| 2019 | $108 | $63,300 | $3,300 | $60,000 |
| 2018 | $100 | $59,200 | $3,300 | $55,900 |
| 2017 | $108 | $59,200 | $3,300 | $55,900 |
| 2016 | $392 | $63,000 | $5,000 | $58,000 |
| 2015 | $385 | $37,800 | $3,000 | $34,800 |
| 2014 | $385 | $33,200 | $3,000 | $30,200 |
Source: Public Records
Map
Nearby Homes