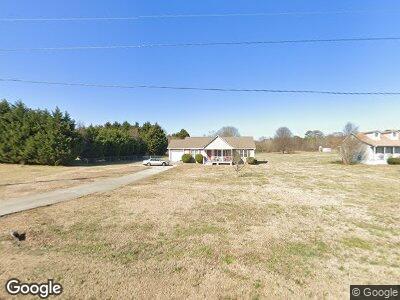
516 Aerodrome Way Griffin, GA 30224
Spalding County NeighborhoodEstimated Value: $229,000 - $254,000
3
Beds
2
Baths
1,200
Sq Ft
$204/Sq Ft
Est. Value
About This Home
This home is located at 516 Aerodrome Way, Griffin, GA 30224 and is currently estimated at $244,806, approximately $204 per square foot. 516 Aerodrome Way is a home located in Spalding County with nearby schools including Moreland Road Elementary School, Carver Road Middle School, and Griffin High School.
Ownership History
Date
Name
Owned For
Owner Type
Purchase Details
Closed on
Jul 15, 2021
Sold by
Hallman Dustin Chad
Bought by
Hancock Jermarlon
Current Estimated Value
Home Financials for this Owner
Home Financials are based on the most recent Mortgage that was taken out on this home.
Original Mortgage
$186,558
Outstanding Balance
$171,167
Interest Rate
2.93%
Mortgage Type
FHA
Estimated Equity
$73,639
Purchase Details
Closed on
May 15, 2003
Sold by
Bray Larry and Bray Cheryl A
Bought by
Hallman Dustin C
Home Financials for this Owner
Home Financials are based on the most recent Mortgage that was taken out on this home.
Original Mortgage
$104,750
Interest Rate
5.76%
Mortgage Type
New Conventional
Purchase Details
Closed on
Feb 29, 1996
Sold by
Pruitt Enterprises
Bought by
Bray Larry Cheryl Ann
Purchase Details
Closed on
Mar 1, 1995
Sold by
Hearn Timothy J
Bought by
Pruitt Enterprises
Create a Home Valuation Report for This Property
The Home Valuation Report is an in-depth analysis detailing your home's value as well as a comparison with similar homes in the area
Home Values in the Area
Average Home Value in this Area
Purchase History
| Date | Buyer | Sale Price | Title Company |
|---|---|---|---|
| Hancock Jermarlon | $190,000 | -- | |
| Hallman Dustin C | $108,000 | -- | |
| Bray Larry Cheryl Ann | $72,000 | -- | |
| Pruitt Enterprises | $10,800 | -- |
Source: Public Records
Mortgage History
| Date | Status | Borrower | Loan Amount |
|---|---|---|---|
| Open | Hancock Jermarlon | $186,558 | |
| Closed | Hancock Jermarlon | $186,558 | |
| Previous Owner | Hallman Dustin Chad | $84,000 | |
| Previous Owner | Hallman Dustin C | $104,750 | |
| Closed | Pruitt Enterprises | $0 |
Source: Public Records
Tax History Compared to Growth
Tax History
| Year | Tax Paid | Tax Assessment Tax Assessment Total Assessment is a certain percentage of the fair market value that is determined by local assessors to be the total taxable value of land and additions on the property. | Land | Improvement |
|---|---|---|---|---|
| 2024 | $2,784 | $79,629 | $9,200 | $70,429 |
| 2023 | $2,784 | $74,494 | $9,200 | $65,294 |
| 2022 | $2,239 | $63,390 | $7,200 | $56,190 |
| 2021 | $1,362 | $39,252 | $7,200 | $32,052 |
| 2020 | $1,267 | $36,525 | $7,200 | $29,325 |
| 2019 | $1,292 | $36,525 | $7,200 | $29,325 |
| 2018 | $1,231 | $34,030 | $7,200 | $26,830 |
| 2017 | $1,198 | $34,030 | $7,200 | $26,830 |
| 2016 | $1,219 | $34,030 | $7,200 | $26,830 |
| 2015 | $1,257 | $34,030 | $7,200 | $26,830 |
| 2014 | $1,282 | $34,030 | $7,200 | $26,830 |
Source: Public Records
Map
Nearby Homes
- 1724 Mary Ave
- 1762 Cheryl Ave
- 571 Lakeside Rd
- 733 S Pine Hill Rd
- 711 S Pine Hill Rd
- 1818 Carrington Dr Unit 1818
- 1745 Carrington Dr
- 1749 Carrington Dr
- 450 Carver Rd
- 372 Moose Lodge Rd
- 714 Carver Rd
- 109 Garnet Ln
- 424 S Pine Hill Rd Unit 1
- 211 Lake Chase Dr N
- 108 Garnet Ln
- 116 Coach Dr
- 113 Lake Chase Dr S
- 1757 Summerwoods Ln
- 100 Slate Dr
- 105 Lake Chase Dr S
- 516 Aerodrome Way
- 512 Aerodrome Way
- 59 Lakeside Rd
- 59 Lakeside Dr
- 55 Lakeside Dr
- 508 Aerodrome Way
- 51 Lakeside Dr
- 0 Aerodrome Way
- 108 Blanton Rd
- 504 Aerodrome Way
- 600 Aerodrome Way
- 102 Blanton Rd
- 47 Lakeside Dr
- 500 Aerodrome Way
- 56 Lakeside Rd
- 56 Lakeside Dr
- 52 Lakeside Dr
- 43 Lakeside Rd
- 48 Lakeside Dr
- 604 Aerodrome Way