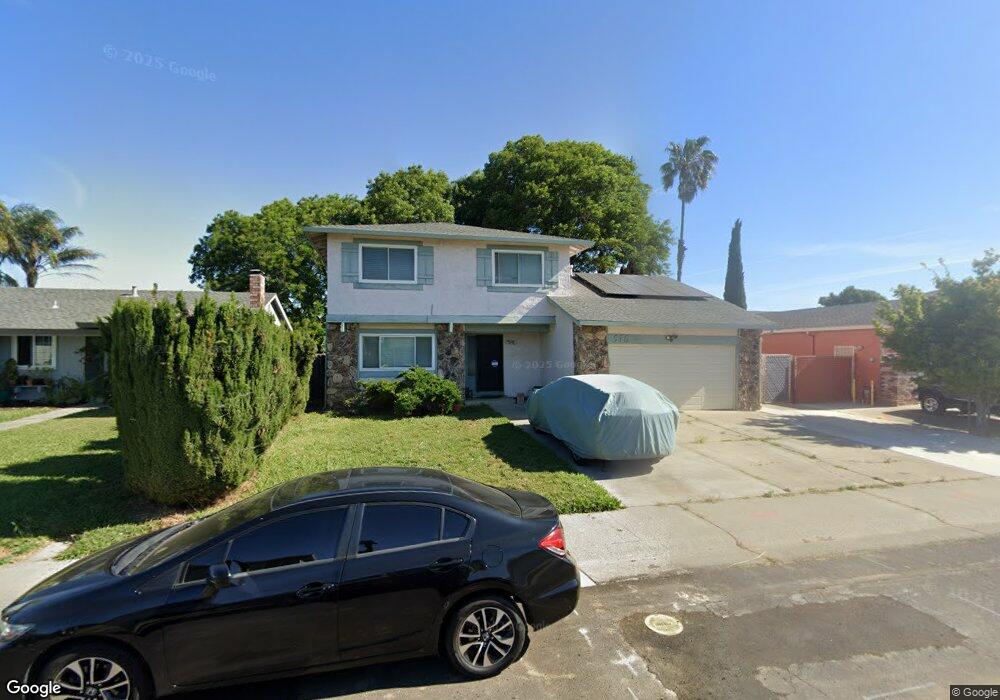
516 Coot Ln Suisun City, CA 94585
Estimated Value: $504,000 - $557,000
4
Beds
3
Baths
1,890
Sq Ft
$282/Sq Ft
Est. Value
About This Home
This home is located at 516 Coot Ln, Suisun City, CA 94585 and is currently estimated at $533,748, approximately $282 per square foot. 516 Coot Ln is a home located in Solano County with nearby schools including Suisun Elementary School, Crystal Middle School, and Armijo High School.
Ownership History
Date
Name
Owned For
Owner Type
Purchase Details
Closed on
Jun 5, 2017
Sold by
Chao Saeng F
Bought by
Chao Saeng Fio and Chao May Lee
Current Estimated Value
Home Financials for this Owner
Home Financials are based on the most recent Mortgage that was taken out on this home.
Original Mortgage
$257,000
Outstanding Balance
$213,829
Interest Rate
4.03%
Mortgage Type
New Conventional
Estimated Equity
$319,919
Purchase Details
Closed on
Aug 23, 2007
Sold by
Chao Saeng F and Chao May L
Bought by
Chao Saeng F
Home Financials for this Owner
Home Financials are based on the most recent Mortgage that was taken out on this home.
Original Mortgage
$326,250
Interest Rate
6.74%
Mortgage Type
Negative Amortization
Purchase Details
Closed on
Apr 21, 2006
Sold by
Chao Saeng F and Chao May L
Bought by
Chao Saeng F and Chao May L
Purchase Details
Closed on
Sep 25, 2001
Sold by
Saechao Saengfio and Saelee Mueychiam
Bought by
Chao Saeng F and Chao May L
Create a Home Valuation Report for This Property
The Home Valuation Report is an in-depth analysis detailing your home's value as well as a comparison with similar homes in the area
Home Values in the Area
Average Home Value in this Area
Purchase History
| Date | Buyer | Sale Price | Title Company |
|---|---|---|---|
| Chao Saeng Fio | -- | None Available | |
| Chao Saeng F | -- | Chicago Title Co | |
| Chao Saeng F | -- | None Available | |
| Chao Saeng F | -- | -- |
Source: Public Records
Mortgage History
| Date | Status | Borrower | Loan Amount |
|---|---|---|---|
| Open | Chao Saeng Fio | $257,000 | |
| Closed | Chao Saeng F | $326,250 |
Source: Public Records
Tax History Compared to Growth
Tax History
| Year | Tax Paid | Tax Assessment Tax Assessment Total Assessment is a certain percentage of the fair market value that is determined by local assessors to be the total taxable value of land and additions on the property. | Land | Improvement |
|---|---|---|---|---|
| 2025 | $3,061 | $261,786 | $78,015 | $183,771 |
| 2024 | $3,061 | $256,654 | $76,486 | $180,168 |
| 2023 | $2,968 | $251,623 | $74,987 | $176,636 |
| 2022 | $2,932 | $246,690 | $73,517 | $173,173 |
| 2021 | $2,903 | $241,854 | $72,076 | $169,778 |
| 2020 | $2,836 | $239,375 | $71,337 | $168,038 |
| 2019 | $2,766 | $234,683 | $69,939 | $164,744 |
| 2018 | $2,877 | $230,082 | $68,568 | $161,514 |
| 2017 | $2,750 | $225,572 | $67,224 | $158,348 |
| 2016 | $2,726 | $221,150 | $65,906 | $155,244 |
| 2015 | $2,551 | $217,830 | $64,917 | $152,913 |
| 2014 | $2,533 | $213,564 | $63,646 | $149,918 |
Source: Public Records
Map
Nearby Homes
- 522 Honker Ln
- 540 Coot Ln
- 953 Mccoy Creek Cir
- 518 Blue Wing Dr
- Berryessa Plan at Midway Meadows
- Adobe Plan at Midway Meadows
- Cordelia Plan at Midway Meadows
- 619 Wigeon Way
- 508 Trumpeter Dr
- 414 Bauman Dr
- 906 Trumpeter Ct
- 800 Spoonbill Ln
- 907 Shelduck Ct
- 815 Golden Eye Way
- 813 Redhead Way
- 616 Emperor Dr
- 829 Tree Duck Way
- 808 Pochard Way
- 1016 Prairie Dr
- 1023 Pintail Dr