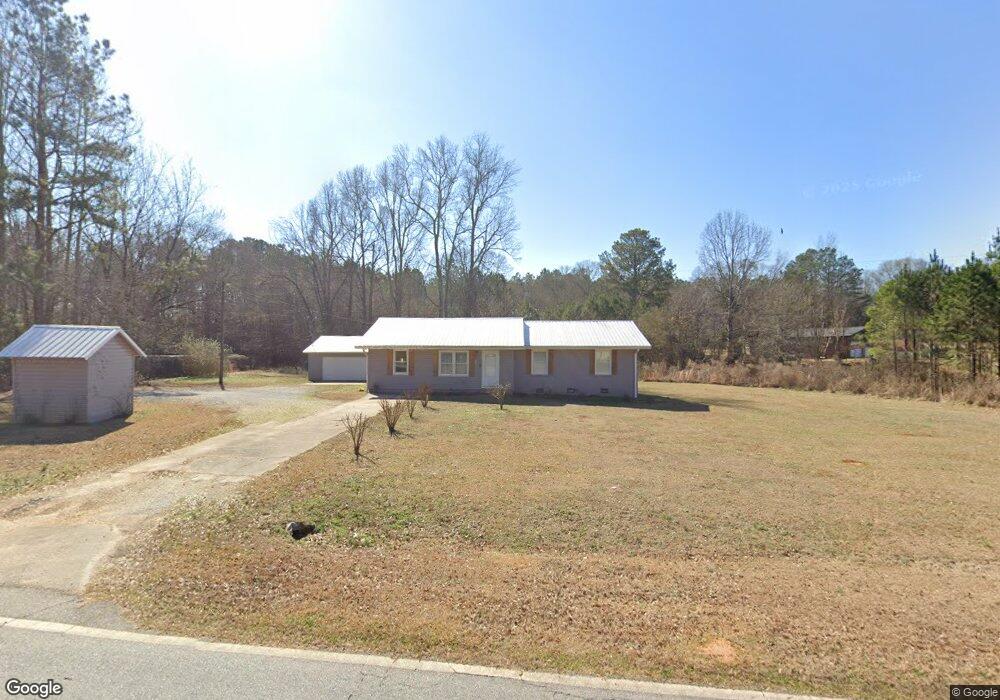
516 Gresham Rd Zebulon, GA 30295
Estimated Value: $254,000 - $418,000
3
Beds
2
Baths
1,388
Sq Ft
$245/Sq Ft
Est. Value
About This Home
This home is located at 516 Gresham Rd, Zebulon, GA 30295 and is currently estimated at $339,964, approximately $244 per square foot. 516 Gresham Rd is a home located in Pike County with nearby schools including Pike County Primary School, Pike County Elementary School, and Pike County Middle School.
Ownership History
Date
Name
Owned For
Owner Type
Purchase Details
Closed on
Feb 18, 2022
Sold by
Echols Wesley E
Bought by
Echols Wesley E and Echols Amy M
Current Estimated Value
Home Financials for this Owner
Home Financials are based on the most recent Mortgage that was taken out on this home.
Original Mortgage
$34,671
Outstanding Balance
$29,082
Interest Rate
3.69%
Mortgage Type
Cash
Estimated Equity
$310,882
Purchase Details
Closed on
Jul 28, 2021
Sold by
Midwest Care Management Svcs Nfp
Bought by
Chapman Hollie
Purchase Details
Closed on
Dec 1, 1992
Sold by
Burrows Nellie
Bought by
Burrows Josephine V
Purchase Details
Closed on
May 6, 1992
Sold by
Burrows Frederick and Burrows Nellie
Bought by
Burrows Nellie and Burrows Josephine
Purchase Details
Closed on
Oct 16, 1973
Bought by
Burrows Frederick and Burrows Nellie
Create a Home Valuation Report for This Property
The Home Valuation Report is an in-depth analysis detailing your home's value as well as a comparison with similar homes in the area
Purchase History
| Date | Buyer | Sale Price | Title Company |
|---|---|---|---|
| Echols Wesley E | -- | -- | |
| Echols Wesley E | $391,389 | -- | |
| Gasaway Angela | $210,000 | -- | |
| Chapman Hollie | $65,000 | -- | |
| Burrows Josephine V | -- | -- | |
| Burrows Nellie | -- | -- | |
| Burrows Frederick | -- | -- |
Source: Public Records
Mortgage History
| Date | Status | Borrower | Loan Amount |
|---|---|---|---|
| Open | Echols Wesley E | $34,671 |
Source: Public Records
Tax History
| Year | Tax Paid | Tax Assessment Tax Assessment Total Assessment is a certain percentage of the fair market value that is determined by local assessors to be the total taxable value of land and additions on the property. | Land | Improvement |
|---|---|---|---|---|
| 2025 | $1,608 | $72,871 | $19,265 | $53,606 |
| 2024 | $1,754 | $76,671 | $20,103 | $56,568 |
| 2023 | $2,225 | $76,671 | $20,103 | $56,568 |
| 2022 | $754 | $49,482 | $15,464 | $34,018 |
| 2021 | $1,328 | $46,136 | $12,118 | $34,018 |
| 2020 | $1,343 | $46,136 | $12,118 | $34,018 |
| 2019 | $1,042 | $32,073 | $7,128 | $24,945 |
| 2018 | $1,043 | $32,073 | $7,128 | $24,945 |
| 2017 | $1,034 | $32,073 | $7,128 | $24,945 |
| 2016 | $960 | $32,074 | $7,128 | $24,945 |
| 2015 | $913 | $32,074 | $7,128 | $24,945 |
| 2014 | $926 | $32,074 | $7,128 | $24,945 |
| 2013 | -- | $32,073 | $7,128 | $24,945 |
Source: Public Records
Map
Nearby Homes
- 550 Gresham Rd
- 159 May Ln
- 218 Quail Dr
- LOT 14 Gresham Rd
- 76 Abbey Ct
- 43 Wellington Dr
- 100 Cambridge Dr S
- 775 Bolton Rd
- 1401 Caldwell Rd
- 567 Kendrick Rd
- 394 Hunter Rd
- 1605 Shackelford Rd
- 14375 U S 19
- TRACT D Hunter Rd
- 143 Buck Trail
- TRACT 3 Grady Maddox Rd
- 17 Brookwood Way
- 15046 U S 19
- 15040 U S Highway 19
- 15040 Highway 19
- 466 Gresham Rd
- 485 Gresham Rd
- 515 Gresham Rd
- 615 Gresham Rd
- 407 Gresham Rd
- 633 Gresham Rd
- 340 Gresham Rd
- 331 Gresham Rd
- 317 Gresham Rd
- 304 Gresham Rd
- 729 Gresham Rd
- 162 Pitts Ln
- 831 Gresham Rd
- 233 Gresham Rd
- 2997 Caldwell Rd
- 0 Gresham NE Unit 3289058
- 3081 Caldwell Rd
- 3057 Caldwell Rd
- 2688 Caldwell Rd
- 2606 Caldwell Rd
Your Personal Tour Guide
Ask me questions while you tour the home.