516 Lakeview Heights Dr Howard, OH 43028
Apple Valley NeighborhoodEstimated Value: $251,000 - $370,060
2
Beds
2
Baths
1,200
Sq Ft
$259/Sq Ft
Est. Value
About This Home
This home is located at 516 Lakeview Heights Dr, Howard, OH 43028 and is currently estimated at $311,265, approximately $259 per square foot. 516 Lakeview Heights Dr is a home located in Knox County with nearby schools including East Knox Elementary School and East Knox High School.
Ownership History
Date
Name
Owned For
Owner Type
Purchase Details
Closed on
Sep 23, 2024
Sold by
King Kevin C and King Elizabeth Platte
Bought by
Kevin C King And Elizabeth P King Family Trus and King
Current Estimated Value
Purchase Details
Closed on
Dec 9, 2020
Sold by
Pool Phillip K
Bought by
King Kevin C & Elizabeth Plate
Home Financials for this Owner
Home Financials are based on the most recent Mortgage that was taken out on this home.
Interest Rate
2.71%
Purchase Details
Closed on
Aug 12, 2007
Sold by
Pool Duane P and Pool Deborah A
Bought by
Pool Phillip K and Pool Mollie R
Purchase Details
Closed on
Jun 24, 1997
Sold by
Pool Phillip K and Pool Mollie R
Bought by
Pool Phillip K and Pool Mollie R
Purchase Details
Closed on
Nov 25, 1996
Sold by
Conrad Jeffery O and Conrad Judi A
Bought by
Pool Phillip K and Pool Mollie R
Purchase Details
Closed on
Sep 9, 1991
Sold by
Curren Lawrence W and Curren Gertr
Bought by
Conrad Jeffery O and Conrad Judi A
Create a Home Valuation Report for This Property
The Home Valuation Report is an in-depth analysis detailing your home's value as well as a comparison with similar homes in the area
Home Values in the Area
Average Home Value in this Area
Purchase History
| Date | Buyer | Sale Price | Title Company |
|---|---|---|---|
| Kevin C King And Elizabeth P King Family Trus | -- | None Listed On Document | |
| King Kevin C & Elizabeth Plate | $281,500 | -- | |
| Pool Phillip K | -- | None Available | |
| Pool Phillip K | -- | -- | |
| Pool Phillip K | $3,000 | -- | |
| Conrad Jeffery O | -- | -- |
Source: Public Records
Mortgage History
| Date | Status | Borrower | Loan Amount |
|---|---|---|---|
| Previous Owner | King Kevin C & Elizabeth Plate | -- | |
| Previous Owner | Pool Phillip K | $100,000 |
Source: Public Records
Tax History Compared to Growth
Tax History
| Year | Tax Paid | Tax Assessment Tax Assessment Total Assessment is a certain percentage of the fair market value that is determined by local assessors to be the total taxable value of land and additions on the property. | Land | Improvement |
|---|---|---|---|---|
| 2024 | $3,296 | $80,500 | $11,290 | $69,210 |
| 2023 | $3,296 | $80,500 | $11,290 | $69,210 |
| 2022 | $2,637 | $55,430 | $7,790 | $47,640 |
| 2021 | $2,637 | $55,430 | $7,790 | $47,640 |
| 2020 | $2,076 | $55,430 | $7,790 | $47,640 |
| 2019 | $1,914 | $48,230 | $10,350 | $37,880 |
| 2018 | $1,792 | $48,230 | $10,350 | $37,880 |
| 2017 | $1,776 | $48,230 | $10,350 | $37,880 |
| 2016 | $1,640 | $44,660 | $9,580 | $35,080 |
| 2015 | $1,493 | $44,660 | $9,580 | $35,080 |
| 2014 | $1,495 | $44,660 | $9,580 | $35,080 |
| 2013 | $1,591 | $45,160 | $10,010 | $35,150 |
Source: Public Records
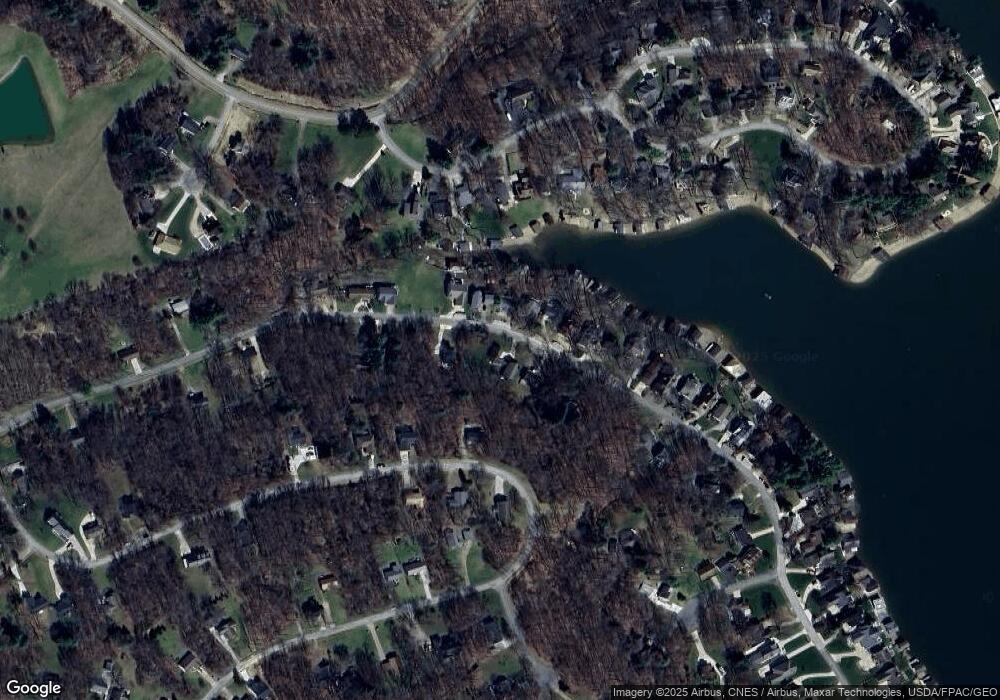
Map
Nearby Homes
- 561 Mcintosh Dr
- 535 Green Acre Cir
- 512 Greenacre Cir
- 232 Northern Spy Dr
- 629 Mcintosh Dr
- 43 Hawkeye Ct
- 2037 Apple Valley Dr Unit 514, 515
- 3162 Apple Valley Dr
- 3142 Apple Valley Dr
- 2536 Apple Valley Dr
- 2536 Apple Valley Dr Unit Lot 298
- 2100 Apple Valley Dr Unit Lot 63
- 1708 Apple Valley Dr
- 1709 Apple Valley Dr
- 531 Crabapple Dr
- 2028 Apple Valley Dr
- 229 Green Valley Dr
- 177 Lakeview Heights Dr
- 770 Winesap Cir
- 610 Crabapple Dr
- 516 Lakeview Heights Dr
- 512 Lakeview Heights Dr
- 504 Lakeview Heights Dr
- 528 Lakeview Heights Dr
- 513 Lakeview Heights Dr
- 517 Lakeview Heights Dr
- 521 Lakeview Heights Dr
- 509 Lakeview Heights Dr
- 525 Lakeview Heights Dr
- 505 Lakeview Heights Dr
- 529 Lakeview Heights Dr
- 501 Lakeview Heights Dr
- 497 Lakeview Heights Dr
- 540 Lakeview Heights Dr
- 552 Mcintosh Dr
- 493 Lakeview Heights Dr
- 541 Lakeview Heights Dr
- 545 Mcintosh Dr
- 529 Mcintosh Dr
- 484 Lakeview Heights Dr