Estimated Value: $228,000 - $276,000
3
Beds
1
Bath
1,093
Sq Ft
$225/Sq Ft
Est. Value
About This Home
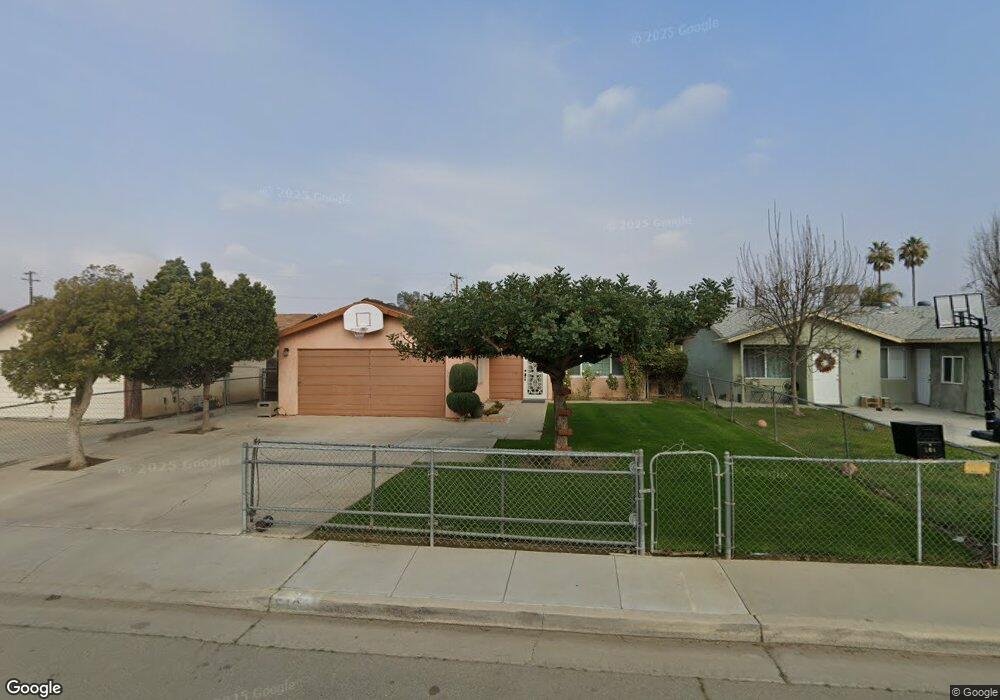
This home is located at 516 Langford Ave, Arvin, CA 93203 and is currently estimated at $245,688, approximately $224 per square foot. 516 Langford Ave is a home located in Kern County with nearby schools including Sierra Vista Elementary School, Haven Drive Middle School, and Arvin High School.
Ownership History
Date
Name
Owned For
Owner Type
Purchase Details
Closed on
Mar 30, 2001
Sold by
Lopez Guadalupe and Lopez Sylvia
Bought by
Lopez Guadalupe and Lopez Sylvia
Current Estimated Value
Home Financials for this Owner
Home Financials are based on the most recent Mortgage that was taken out on this home.
Original Mortgage
$65,772
Outstanding Balance
$24,174
Interest Rate
6.98%
Estimated Equity
$221,514
Purchase Details
Closed on
Sep 23, 1994
Sold by
Lopez Guadalupe
Bought by
Vargas Toribio Lopez
Home Financials for this Owner
Home Financials are based on the most recent Mortgage that was taken out on this home.
Original Mortgage
$71,881
Interest Rate
8.55%
Mortgage Type
FHA
Purchase Details
Closed on
Sep 20, 1994
Sold by
Perez Jose L and Perez Maria C
Bought by
Lopez Guadalupe and Lopez Silvia
Home Financials for this Owner
Home Financials are based on the most recent Mortgage that was taken out on this home.
Original Mortgage
$71,881
Interest Rate
8.55%
Mortgage Type
FHA
Create a Home Valuation Report for This Property
The Home Valuation Report is an in-depth analysis detailing your home's value as well as a comparison with similar homes in the area
Home Values in the Area
Average Home Value in this Area
Purchase History
| Date | Buyer | Sale Price | Title Company |
|---|---|---|---|
| Lopez Guadalupe | -- | First American Title Co | |
| Vargas Toribio Lopez | -- | Fidelity National Title | |
| Lopez Guadalupe | $72,000 | Fidelity National Title |
Source: Public Records
Mortgage History
| Date | Status | Borrower | Loan Amount |
|---|---|---|---|
| Open | Lopez Guadalupe | $65,772 | |
| Previous Owner | Lopez Guadalupe | $71,881 |
Source: Public Records
Tax History Compared to Growth
Tax History
| Year | Tax Paid | Tax Assessment Tax Assessment Total Assessment is a certain percentage of the fair market value that is determined by local assessors to be the total taxable value of land and additions on the property. | Land | Improvement |
|---|---|---|---|---|
| 2025 | $2,442 | $120,113 | $25,013 | $95,100 |
| 2024 | $2,335 | $117,759 | $24,523 | $93,236 |
| 2023 | $2,335 | $115,451 | $24,043 | $91,408 |
| 2022 | $2,277 | $113,188 | $23,572 | $89,616 |
| 2021 | $2,182 | $110,969 | $23,110 | $87,859 |
| 2020 | $2,143 | $109,832 | $22,873 | $86,959 |
| 2019 | $2,117 | $109,832 | $22,873 | $86,959 |
| 2018 | $2,061 | $105,569 | $21,986 | $83,583 |
| 2017 | $1,998 | $103,501 | $21,556 | $81,945 |
| 2016 | $1,896 | $101,472 | $21,134 | $80,338 |
| 2015 | $1,833 | $99,949 | $20,817 | $79,132 |
| 2014 | $1,790 | $97,992 | $20,409 | $77,583 |
Source: Public Records
Map
Nearby Homes
- 828 Stockton Ave
- 776 Butte Ave
- 140 Langford Ave
- 795 S Derby St
- 931 S Derby St
- 801 Schipper St Unit 20
- 801 Schipper St Unit 65
- 801 Schipper St Unit 86
- 801 Schipper St Unit 60
- 801 Schipper St Unit 31
- 801 Schipper St Unit 46
- 1348 Haven Dr
- 0 Tejon Hwy
- 1708 Payne Dr
- 1200 Royal St
- 301 Walker St
- 249 Monroe St
- 698 S Comanche Dr
- 0 S Comanche Dr
- 1777 S Comanche Dr
- 508 Langford Ave
- 524 Langford Ave
- 500 Langford Ave
- 532 Langford Ave
- 465 Combs Ave
- 432 Langford Ave
- 540 Langford Ave
- 473 Combs Ave
- 457 Combs Ave
- 481 Combs Ave
- 449 Combs Ave
- 424 Langford Ave
- 489 Combs Ave
- 441 Combs Ave
- 525 Langford Ave
- 433 Combs Ave
- 416 Langford Ave
- 600 Langford Ave
- 425 Combs Ave
- 601 Combs Ave