Estimated Value: $145,671 - $178,000
3
Beds
1
Bath
1,017
Sq Ft
$156/Sq Ft
Est. Value
About This Home
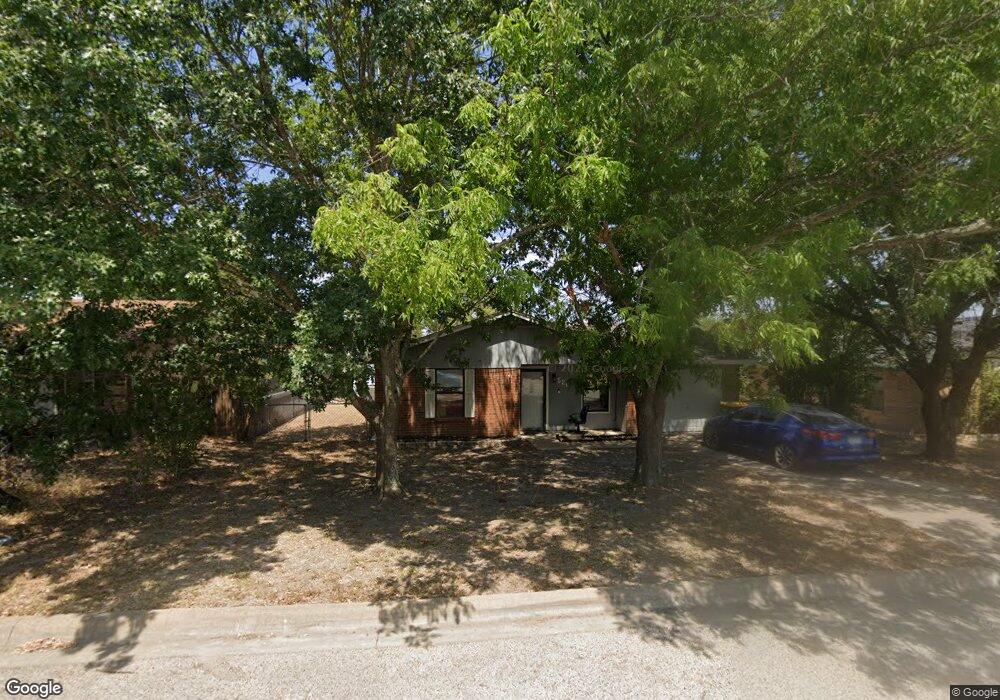
This home is located at 516 Lisa Cir, Troy, TX 76579 and is currently estimated at $158,168, approximately $155 per square foot. 516 Lisa Cir is a home located in Bell County with nearby schools including Edna Bigham Mays Elementary School, Troy Elementary School, and Raymond Mays Middle School.
Ownership History
Date
Name
Owned For
Owner Type
Purchase Details
Closed on
Feb 17, 2017
Sold by
Aynsely Katherine and Mays Katie
Bought by
Jeskie Marie
Current Estimated Value
Home Financials for this Owner
Home Financials are based on the most recent Mortgage that was taken out on this home.
Original Mortgage
$72,659
Outstanding Balance
$60,853
Interest Rate
4.62%
Mortgage Type
FHA
Estimated Equity
$97,315
Purchase Details
Closed on
Dec 17, 2007
Sold by
Davis Oleta H and Davis Melvin H
Bought by
Mays Byron
Home Financials for this Owner
Home Financials are based on the most recent Mortgage that was taken out on this home.
Original Mortgage
$77,287
Interest Rate
6.3%
Mortgage Type
Purchase Money Mortgage
Purchase Details
Closed on
May 21, 1998
Sold by
Elliott William C
Bought by
Davis Oleta
Create a Home Valuation Report for This Property
The Home Valuation Report is an in-depth analysis detailing your home's value as well as a comparison with similar homes in the area
Home Values in the Area
Average Home Value in this Area
Purchase History
| Date | Buyer | Sale Price | Title Company |
|---|---|---|---|
| Jeskie Marie | -- | Centraland Title Co | |
| Mays Byron | -- | Monteith Abstract & Title Co | |
| Davis Oleta | -- | -- |
Source: Public Records
Mortgage History
| Date | Status | Borrower | Loan Amount |
|---|---|---|---|
| Open | Jeskie Marie | $72,659 | |
| Previous Owner | Mays Byron | $77,287 |
Source: Public Records
Tax History Compared to Growth
Tax History
| Year | Tax Paid | Tax Assessment Tax Assessment Total Assessment is a certain percentage of the fair market value that is determined by local assessors to be the total taxable value of land and additions on the property. | Land | Improvement |
|---|---|---|---|---|
| 2025 | $1,030 | $120,927 | $18,975 | $101,952 |
| 2024 | $1,030 | $112,226 | -- | -- |
| 2023 | $1,938 | $115,495 | $7,425 | $108,070 |
| 2022 | $2,003 | $102,852 | $6,600 | $96,252 |
| 2021 | $1,897 | $84,317 | $6,600 | $77,717 |
| 2020 | $2,054 | $84,198 | $6,600 | $77,598 |
| 2019 | $1,884 | $79,151 | $6,600 | $72,551 |
| 2018 | $1,765 | $74,156 | $3,300 | $70,856 |
| 2017 | $1,688 | $70,314 | $3,300 | $69,481 |
| 2016 | $1,534 | $63,922 | $3,300 | $60,622 |
| 2015 | $1,596 | $63,458 | $3,300 | $60,158 |
| 2014 | $1,596 | $74,887 | $0 | $0 |
Source: Public Records
Map
Nearby Homes