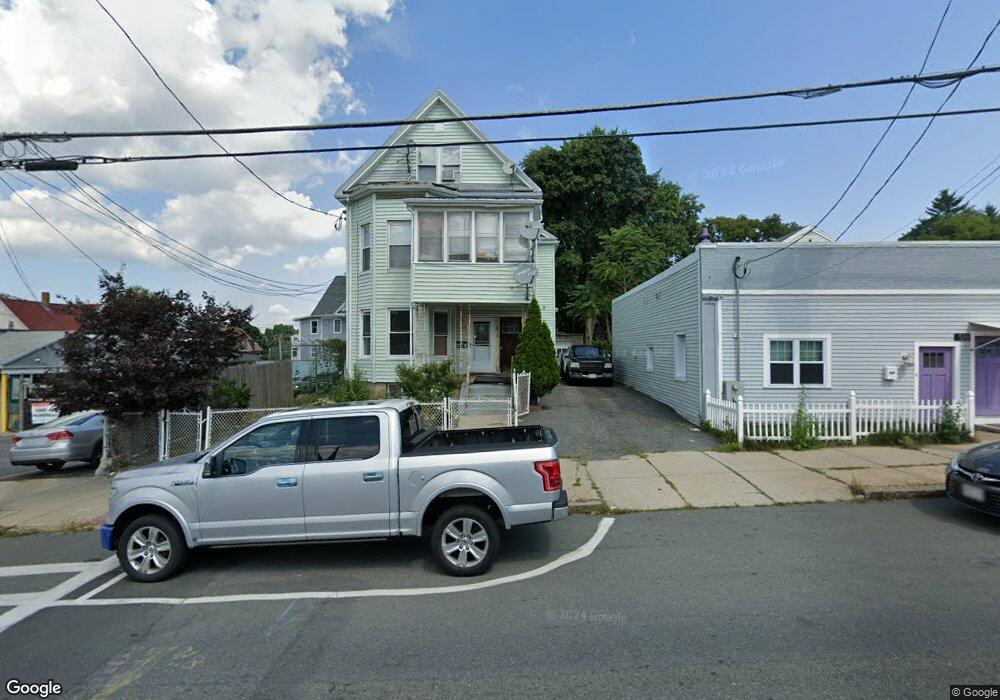
516 Main St Medford, MA 02155
South Medford NeighborhoodEstimated Value: $916,000 - $1,085,000
4
Beds
3
Baths
2,775
Sq Ft
$364/Sq Ft
Est. Value
About This Home
This home is located at 516 Main St, Medford, MA 02155 and is currently estimated at $1,011,000, approximately $364 per square foot. 516 Main St is a home located in Middlesex County with nearby schools including Medford High School, St. Clement Elementary School, and Bright Future Educare Center.
Ownership History
Date
Name
Owned For
Owner Type
Purchase Details
Closed on
Jul 10, 2014
Sold by
Torres Jose and Morales Nelson
Bought by
Torres Jose B and Torres Elva
Current Estimated Value
Purchase Details
Closed on
Oct 5, 1999
Sold by
Hakar Linda S
Bought by
Torres Jose and Morales Nelson
Home Financials for this Owner
Home Financials are based on the most recent Mortgage that was taken out on this home.
Original Mortgage
$191,200
Interest Rate
7.85%
Mortgage Type
Purchase Money Mortgage
Create a Home Valuation Report for This Property
The Home Valuation Report is an in-depth analysis detailing your home's value as well as a comparison with similar homes in the area
Home Values in the Area
Average Home Value in this Area
Purchase History
| Date | Buyer | Sale Price | Title Company |
|---|---|---|---|
| Torres Jose B | -- | -- | |
| Torres Jose | $239,000 | -- |
Source: Public Records
Mortgage History
| Date | Status | Borrower | Loan Amount |
|---|---|---|---|
| Previous Owner | Torres Jose | $191,200 | |
| Closed | Torres Jose | $35,850 |
Source: Public Records
Tax History Compared to Growth
Tax History
| Year | Tax Paid | Tax Assessment Tax Assessment Total Assessment is a certain percentage of the fair market value that is determined by local assessors to be the total taxable value of land and additions on the property. | Land | Improvement |
|---|---|---|---|---|
| 2025 | $7,776 | $883,600 | $319,400 | $564,200 |
| 2024 | $6,613 | $776,200 | $304,200 | $472,000 |
| 2023 | $6,461 | $746,900 | $284,300 | $462,600 |
| 2022 | $6,496 | $721,000 | $258,400 | $462,600 |
| 2021 | $6,115 | $649,800 | $246,100 | $403,700 |
| 2020 | $6,026 | $656,400 | $246,100 | $410,300 |
| 2019 | $5,741 | $598,000 | $223,700 | $374,300 |
| 2018 | $2,067 | $533,600 | $203,400 | $330,200 |
| 2017 | $5,132 | $486,000 | $190,100 | $295,900 |
| 2016 | $5,006 | $447,400 | $172,800 | $274,600 |
| 2015 | $4,737 | $404,900 | $164,600 | $240,300 |
Source: Public Records
Map
Nearby Homes
- 501 Main St
- 552 Main St
- 57 Edward St
- 561 Broadway Unit C1
- 595 Broadway Unit 302
- 595 Broadway Unit 101
- 595 Broadway Unit 202
- 474 Broadway Unit 26
- 34 Fiske Ave Unit C
- 34 Fiske Ave Unit B
- 34 Fiske Ave Unit A
- 3 Vinal St
- 9 Norwood Ave
- 32 Richardson St
- 35 Richardson St Unit 2
- 35 Richardson St Unit 4
- 35 Richardson St Unit 3
- 35 Richardson St Unit 1
- 35 Richardson St Unit Cottage
- 11 Bonner Ave Unit 2
- 518 Main St Unit 2
- 518 Main St Unit 1
- 518 Main St Unit B
- 518 Main St Unit A
- 518 Main St
- 522 Main St
- 519 Main St
- 521 Main St Unit 2A
- 521 Main St Unit 1
- 524 Main St
- 524 Main St Unit 1
- 11 Hicks Ave Unit 2
- 11 Hicks Ave Unit 3
- 11 Hicks Ave Unit 1
- 11 Hicks Ave
- 523 Main St
- 528 Main St
- 528 Main St Unit 2
- 525 Main St
- 525 Main St Unit 1