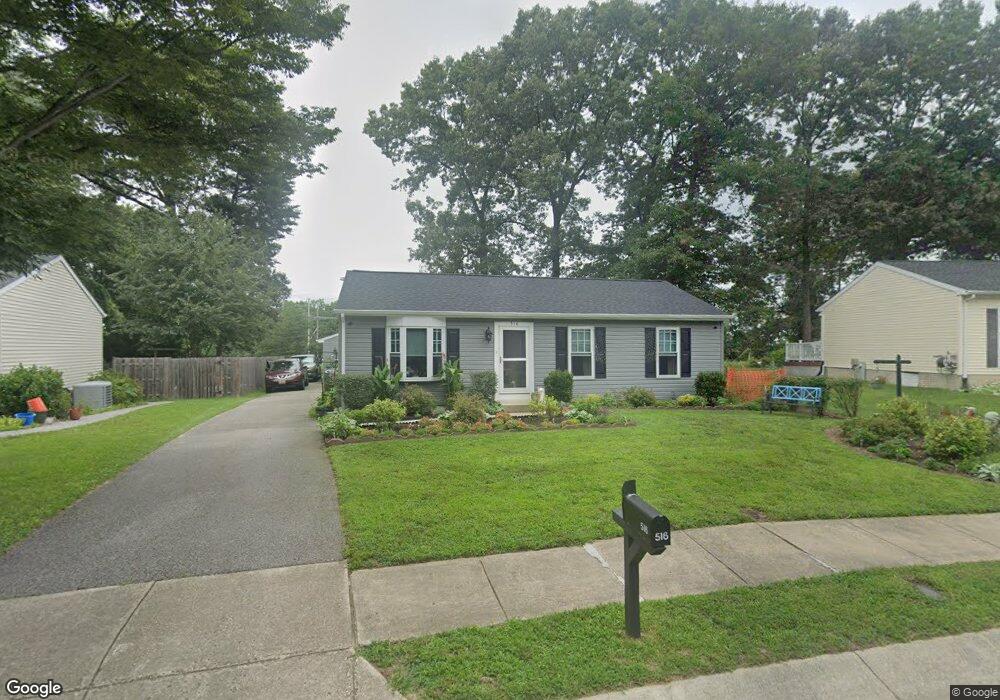
516 Oakton Rd Odenton, MD 21113
Estimated Value: $355,000
Studio
2
Baths
1,520
Sq Ft
$234/Sq Ft
Est. Value
About This Home
This home is located at 516 Oakton Rd, Odenton, MD 21113 and is currently priced at $355,000, approximately $233 per square foot. 516 Oakton Rd is a home located in Anne Arundel County with nearby schools including Odenton Elementary School, Arundel Middle School, and Arundel High School.
Ownership History
Date
Name
Owned For
Owner Type
Purchase Details
Closed on
Jan 31, 2018
Sold by
Walker Mark S
Bought by
Walker Mark S and Walker Bonnie Ann
Current Estimated Value
Home Financials for this Owner
Home Financials are based on the most recent Mortgage that was taken out on this home.
Original Mortgage
$115,000
Outstanding Balance
$81,707
Interest Rate
3.99%
Mortgage Type
New Conventional
Purchase Details
Closed on
Jun 8, 1993
Sold by
Bonaventure Group Ltd Ptnshp
Bought by
Walker Mark S
Home Financials for this Owner
Home Financials are based on the most recent Mortgage that was taken out on this home.
Original Mortgage
$83,500
Interest Rate
7.47%
Purchase Details
Closed on
Jun 8, 1992
Sold by
Bonaventure North Associates
Bought by
Bonaventure Group Ltd Ptnshp
Home Financials for this Owner
Home Financials are based on the most recent Mortgage that was taken out on this home.
Original Mortgage
$328,000
Interest Rate
8.59%
Create a Home Valuation Report for This Property
The Home Valuation Report is an in-depth analysis detailing your home's value as well as a comparison with similar homes in the area
Home Values in the Area
Average Home Value in this Area
Purchase History
| Date | Buyer | Sale Price | Title Company |
|---|---|---|---|
| Walker Mark S | -- | None Available | |
| Walker Mark S | $93,500 | -- | |
| Bonaventure Group Ltd Ptnshp | $328,000 | -- |
Source: Public Records
Mortgage History
| Date | Status | Borrower | Loan Amount |
|---|---|---|---|
| Open | Walker Mark S | $115,000 | |
| Closed | Walker Mark S | $83,500 | |
| Previous Owner | Bonaventure Group Ltd Ptnshp | $328,000 |
Source: Public Records
Tax History
| Year | Tax Paid | Tax Assessment Tax Assessment Total Assessment is a certain percentage of the fair market value that is determined by local assessors to be the total taxable value of land and additions on the property. | Land | Improvement |
|---|---|---|---|---|
| 2025 | $906 | $329,000 | $156,800 | $172,200 |
| 2024 | $906 | $309,167 | $0 | $0 |
| 2023 | $2,783 | $289,333 | $0 | $0 |
| 2022 | $2,586 | $269,500 | $156,800 | $112,700 |
| 2020 | $2,470 | $269,500 | $156,800 | $112,700 |
| 2019 | $2,451 | $280,800 | $168,100 | $112,700 |
| 2018 | $2,636 | $259,967 | $0 | $0 |
| 2017 | $2,272 | $239,133 | $0 | $0 |
| 2016 | -- | $218,300 | $0 | $0 |
| 2015 | -- | $218,300 | $0 | $0 |
| 2014 | -- | $218,300 | $0 | $0 |
Source: Public Records
Map
Nearby Homes
- 441 Harding Ave
- 467 Oakton Rd
- 604 Moonglow Rd Unit 104
- 508 Greencrest Ln
- 488 Bruce Ave
- 324 Mount Vernon Ave
- 497 Bruce Ave
- 1123 Odenton Rd
- 1527 Wampanoag Dr
- 357 Council Oak Dr
- 206 Mccamish Ct
- 1536 Winfields Ln
- 454 N Patuxent Rd
- 1241 Duke Ln
- 1624 Shannon O Cir
- 438 Burns Crossing Rd
- 488 N Patuxent Rd Unit 19A
- 623 Chapelgate Dr
- 1303 Tenbrook Rd
- 1823 Kellington Ct
Your Personal Tour Guide
Ask me questions while you tour the home.