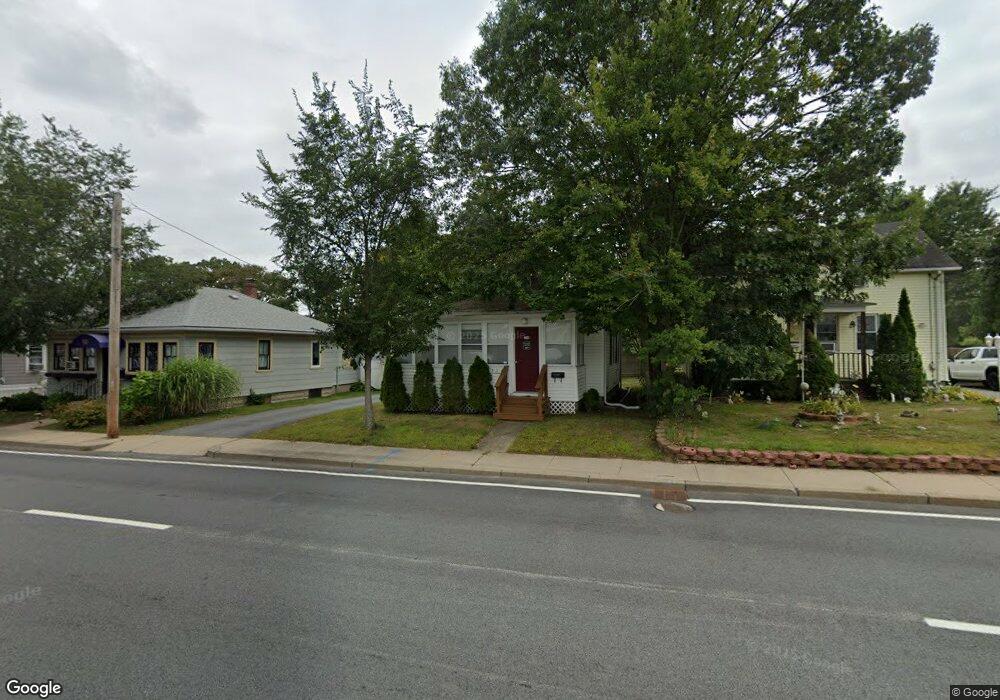
516 Post Rd Warwick, RI 02888
Spring Green NeighborhoodEstimated Value: $267,000 - $299,000
1
Bed
1
Bath
648
Sq Ft
$442/Sq Ft
Est. Value
About This Home
This home is located at 516 Post Rd, Warwick, RI 02888 and is currently estimated at $286,404, approximately $441 per square foot. 516 Post Rd is a home located in Kent County with nearby schools including St. Peter School and Saint Paul School.
Ownership History
Date
Name
Owned For
Owner Type
Purchase Details
Closed on
Apr 7, 2017
Sold by
Gallogly Paul
Bought by
Gallogly Brian P and Bullen Kerry H
Current Estimated Value
Purchase Details
Closed on
Jun 19, 2009
Sold by
Fnma
Bought by
Gallogly Paul
Purchase Details
Closed on
Jun 24, 2002
Sold by
Hunt George J and Hunt Patricia A
Bought by
Greene Michelle M
Home Financials for this Owner
Home Financials are based on the most recent Mortgage that was taken out on this home.
Original Mortgage
$67,750
Interest Rate
6.81%
Mortgage Type
Purchase Money Mortgage
Create a Home Valuation Report for This Property
The Home Valuation Report is an in-depth analysis detailing your home's value as well as a comparison with similar homes in the area
Home Values in the Area
Average Home Value in this Area
Purchase History
| Date | Buyer | Sale Price | Title Company |
|---|---|---|---|
| Gallogly Brian P | -- | -- | |
| Gallogly Paul | $45,000 | -- | |
| Greene Michelle M | $84,700 | -- |
Source: Public Records
Mortgage History
| Date | Status | Borrower | Loan Amount |
|---|---|---|---|
| Previous Owner | Greene Michelle M | $15,000 | |
| Previous Owner | Greene Michelle M | $126,500 | |
| Previous Owner | Greene Michelle M | $67,750 |
Source: Public Records
Tax History
| Year | Tax Paid | Tax Assessment Tax Assessment Total Assessment is a certain percentage of the fair market value that is determined by local assessors to be the total taxable value of land and additions on the property. | Land | Improvement |
|---|---|---|---|---|
| 2025 | $3,354 | $264,100 | $98,200 | $165,900 |
| 2024 | $2,864 | $197,900 | $80,200 | $117,700 |
| 2023 | $2,808 | $197,900 | $80,200 | $117,700 |
| 2022 | $2,478 | $132,300 | $48,600 | $83,700 |
| 2021 | $2,478 | $132,300 | $48,600 | $83,700 |
| 2020 | $2,478 | $132,300 | $48,600 | $83,700 |
| 2019 | $2,478 | $132,300 | $48,600 | $83,700 |
| 2018 | $2,016 | $96,900 | $48,100 | $48,800 |
| 2017 | $1,961 | $96,900 | $48,100 | $48,800 |
| 2016 | $1,961 | $96,900 | $48,100 | $48,800 |
| 2015 | $1,616 | $77,900 | $36,400 | $41,500 |
| 2014 | $1,563 | $77,900 | $36,400 | $41,500 |
| 2013 | $1,542 | $77,900 | $36,400 | $41,500 |
Source: Public Records
Map
Nearby Homes
- 210 Irving Rd
- 25 Newfield Ave
- 27 Vickery St
- 115 Irving Rd
- 94 Holmes Rd
- 136 Sherwood Ave
- 120 Sherwood Ave
- 127 Sherwood Ave
- 111 Sherwood Ave
- 171 Sherwood Ave
- 200 Post Rd Unit 419
- 56 Errol St
- 821 Post Rd
- 80 George St
- 65 Perkins Ave
- 63 Benbridge Ave
- 408 Fair St
- 28 Manchester St
- 29 Malvern Ave
- 129 1st Ave
Your Personal Tour Guide
Ask me questions while you tour the home.