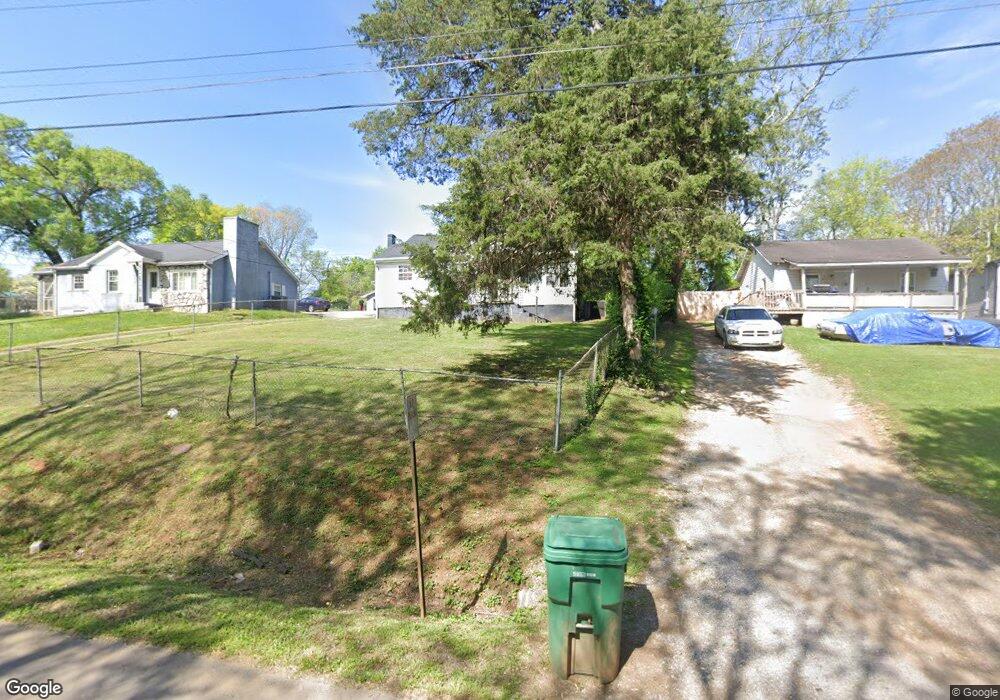
516 S Fairmont Ave Morristown, TN 37813
Estimated Value: $97,000 - $178,000
2
Beds
1
Bath
972
Sq Ft
$155/Sq Ft
Est. Value
About This Home
This home is located at 516 S Fairmont Ave, Morristown, TN 37813 and is currently estimated at $151,098, approximately $155 per square foot. 516 S Fairmont Ave is a home located in Hamblen County with nearby schools including Lincoln Heights Elementary School, Lincoln Heights Middle School, and Morristown West High School.
Ownership History
Date
Name
Owned For
Owner Type
Purchase Details
Closed on
Jun 15, 2018
Sold by
Trent Scott
Bought by
Sutter Kathleen
Current Estimated Value
Purchase Details
Closed on
Dec 1, 2017
Sold by
Jefferson Federal Bank
Bought by
Trent Scott
Purchase Details
Closed on
May 1, 2003
Sold by
Federal National Mortgage Association
Bought by
Solomon Kenneth E
Purchase Details
Closed on
Mar 13, 2003
Bought by
Federal National Mortgage Assoc Ste 1900
Purchase Details
Closed on
Jan 14, 1997
Sold by
Parkins William L
Bought by
Sarah Hoskins
Purchase Details
Closed on
Apr 10, 1995
Sold by
Francis Deloris J
Bought by
Parkins William L
Purchase Details
Closed on
Sep 10, 1992
Bought by
Francis Deloris J
Purchase Details
Closed on
Feb 2, 1988
Bought by
Stram Roger
Purchase Details
Closed on
Jul 30, 1987
Bought by
Darnell Danny and Courtney Bob
Purchase Details
Closed on
Nov 7, 1979
Bought by
Hurd Jeanette
Create a Home Valuation Report for This Property
The Home Valuation Report is an in-depth analysis detailing your home's value as well as a comparison with similar homes in the area
Home Values in the Area
Average Home Value in this Area
Purchase History
| Date | Buyer | Sale Price | Title Company |
|---|---|---|---|
| Sutter Kathleen | $50,000 | Lakeway Title Services | |
| Trent Scott | $34,100 | None Available | |
| Solomon Kenneth E | $20,500 | -- | |
| Federal National Mortgage Assoc Ste 1900 | $46,800 | -- | |
| Sarah Hoskins | $37,000 | -- | |
| Parkins William L | $35,000 | -- | |
| Francis Deloris J | -- | -- | |
| Stram Roger | -- | -- | |
| Darnell Danny | -- | -- | |
| Hurd Jeanette | -- | -- |
Source: Public Records
Tax History Compared to Growth
Tax History
| Year | Tax Paid | Tax Assessment Tax Assessment Total Assessment is a certain percentage of the fair market value that is determined by local assessors to be the total taxable value of land and additions on the property. | Land | Improvement |
|---|---|---|---|---|
| 2024 | $299 | $16,975 | $3,350 | $13,625 |
| 2023 | $299 | $16,975 | $0 | $0 |
| 2022 | $537 | $16,975 | $3,350 | $13,625 |
| 2021 | $537 | $16,975 | $3,350 | $13,625 |
| 2020 | $536 | $16,975 | $3,350 | $13,625 |
| 2019 | $535 | $15,750 | $3,050 | $12,700 |
| 2018 | $496 | $15,750 | $3,050 | $12,700 |
| 2017 | $488 | $15,750 | $3,050 | $12,700 |
| 2016 | $466 | $15,750 | $3,050 | $12,700 |
| 2015 | $434 | $15,750 | $3,050 | $12,700 |
| 2014 | -- | $15,750 | $3,050 | $12,700 |
| 2013 | -- | $17,975 | $0 | $0 |
Source: Public Records
Map
Nearby Homes
- 440 S Fairmont Ave
- 837 Pauline Ave
- 731 Lennie Ave
- 203 Lincoln Ave
- 1530 Rayburn Dr
- 816 W 2nd St N
- 900 Baird Ave
- 1476 Darbee Dr
- 1211 W 6th St N
- 1002 Watercrest St
- 722 W 2nd St N
- 323 Pauline Ave
- 811 Crescent St
- 1442 Darbee Dr
- 529 N Jackson St
- 0 Mcfarland St
- 707 Walters Dr
- 2078 Edgewater Sound Rd
- Darwin Plan at Southwood
- Penwell Plan at Southwood
- 510 S Fairmont Ave
- 506 S Fairmont Ave
- 530 S Fairmont Ave
- 409 Jarnigan Ave
- 421 Jarnigan Ave
- 403 Jarnigan Ave
- 526 Valley St
- 436 S Fairmont Ave
- 1522 Godwin St
- 520 Valley St
- 528 Valley St
- 540 S Fairmont Ave
- 427 Jarnigan Ave
- 355 Jarnigan Ave
- 514 Valley St
- 530 Valley St
- 432 S Fairmont Ave
- 510 Valley St
- 431 Jarnigan Ave
- 349 Jarnigan Ave