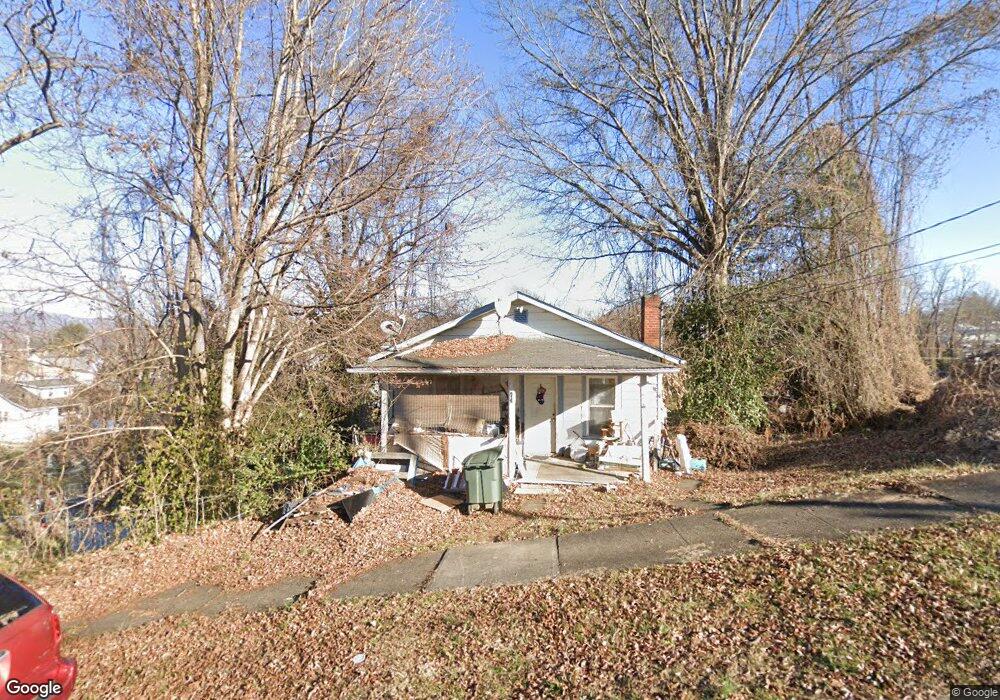
516 S Lynn Ave Elizabethton, TN 37643
Estimated Value: $95,000 - $161,000
--
Bed
--
Bath
768
Sq Ft
$156/Sq Ft
Est. Value
About This Home
This home is located at 516 S Lynn Ave, Elizabethton, TN 37643 and is currently estimated at $119,581, approximately $155 per square foot. 516 S Lynn Ave is a home with nearby schools including Elizabethton High School and East Tn Christian Home & Academy.
Ownership History
Date
Name
Owned For
Owner Type
Purchase Details
Closed on
Feb 15, 2017
Sold by
Lawrence Nadzan
Bought by
Galliher David Christopher
Current Estimated Value
Purchase Details
Closed on
Apr 4, 2008
Sold by
Hubbard Sherry Ellis
Bought by
Nadzan Lawrence
Purchase Details
Closed on
Sep 23, 1997
Sold by
Elliott Minnie
Bought by
Ellis Harold
Home Financials for this Owner
Home Financials are based on the most recent Mortgage that was taken out on this home.
Original Mortgage
$38,000
Interest Rate
7.46%
Purchase Details
Closed on
Jan 19, 1971
Bought by
Elliott Minnie
Purchase Details
Closed on
Jun 16, 1943
Create a Home Valuation Report for This Property
The Home Valuation Report is an in-depth analysis detailing your home's value as well as a comparison with similar homes in the area
Home Values in the Area
Average Home Value in this Area
Purchase History
| Date | Buyer | Sale Price | Title Company |
|---|---|---|---|
| Galliher David Christopher | $27,530 | -- | |
| Nadzan Lawrence | $42,000 | -- | |
| Ellis Harold | $31,200 | -- | |
| Elliott Minnie | -- | -- | |
| -- | -- | -- |
Source: Public Records
Mortgage History
| Date | Status | Borrower | Loan Amount |
|---|---|---|---|
| Previous Owner | Not Available | $38,000 |
Source: Public Records
Tax History Compared to Growth
Tax History
| Year | Tax Paid | Tax Assessment Tax Assessment Total Assessment is a certain percentage of the fair market value that is determined by local assessors to be the total taxable value of land and additions on the property. | Land | Improvement |
|---|---|---|---|---|
| 2024 | $684 | $20,750 | $10,125 | $10,625 |
| 2023 | $684 | $20,750 | $0 | $0 |
| 2022 | $747 | $20,750 | $10,125 | $10,625 |
| 2021 | $421 | $20,750 | $10,125 | $10,625 |
| 2020 | $399 | $20,750 | $10,125 | $10,625 |
| 2019 | $399 | $9,225 | $4,175 | $5,050 |
| 2018 | $393 | $9,225 | $4,175 | $5,050 |
| 2017 | $393 | $9,225 | $4,175 | $5,050 |
| 2016 | $391 | $9,225 | $4,175 | $5,050 |
| 2015 | $392 | $9,225 | $4,175 | $5,050 |
| 2014 | $479 | $11,225 | $3,125 | $8,100 |
Source: Public Records
Map
Nearby Homes