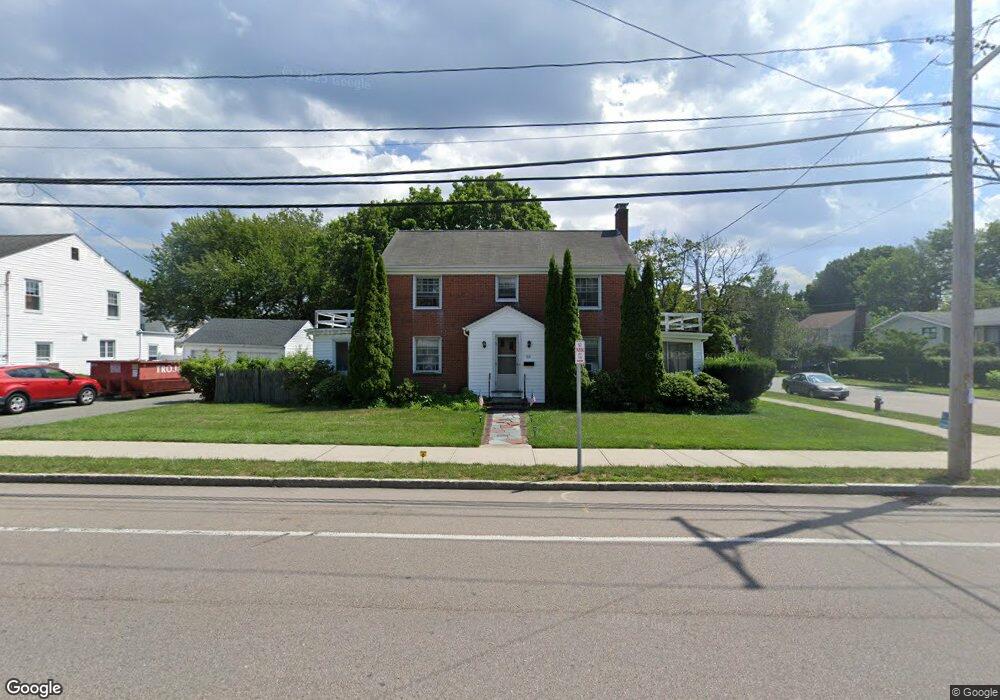
516 W Elm St Brockton, MA 02301
Estimated Value: $589,244 - $659,000
3
Beds
2
Baths
2,028
Sq Ft
$306/Sq Ft
Est. Value
About This Home
This home is located at 516 W Elm St, Brockton, MA 02301 and is currently estimated at $619,811, approximately $305 per square foot. 516 W Elm St is a home located in Plymouth County with nearby schools including Manthala George Jr. School, Hancock Elementary School, and Louis F Angelo Elementary School.
Ownership History
Date
Name
Owned For
Owner Type
Purchase Details
Closed on
Nov 1, 2002
Sold by
Lieber Sara A
Bought by
Protentis Scott and Palmer Michele L
Current Estimated Value
Home Financials for this Owner
Home Financials are based on the most recent Mortgage that was taken out on this home.
Original Mortgage
$286,950
Interest Rate
6.09%
Mortgage Type
Purchase Money Mortgage
Create a Home Valuation Report for This Property
The Home Valuation Report is an in-depth analysis detailing your home's value as well as a comparison with similar homes in the area
Home Values in the Area
Average Home Value in this Area
Purchase History
| Date | Buyer | Sale Price | Title Company |
|---|---|---|---|
| Protentis Scott | $280,000 | -- |
Source: Public Records
Mortgage History
| Date | Status | Borrower | Loan Amount |
|---|---|---|---|
| Open | Protentis Scott | $300,000 | |
| Closed | Protentis Scott | $286,950 |
Source: Public Records
Tax History Compared to Growth
Tax History
| Year | Tax Paid | Tax Assessment Tax Assessment Total Assessment is a certain percentage of the fair market value that is determined by local assessors to be the total taxable value of land and additions on the property. | Land | Improvement |
|---|---|---|---|---|
| 2025 | $6,022 | $497,300 | $144,200 | $353,100 |
| 2024 | $5,954 | $495,300 | $144,200 | $351,100 |
| 2023 | $5,842 | $450,100 | $108,900 | $341,200 |
| 2022 | $5,651 | $404,500 | $98,900 | $305,600 |
| 2021 | $5,362 | $369,800 | $91,800 | $278,000 |
| 2020 | $5,313 | $350,700 | $88,100 | $262,600 |
| 2019 | $5,198 | $334,500 | $81,700 | $252,800 |
| 2018 | $4,840 | $301,400 | $81,700 | $219,700 |
| 2017 | $4,344 | $269,800 | $81,700 | $188,100 |
| 2016 | $4,751 | $273,700 | $77,900 | $195,800 |
| 2015 | $4,175 | $230,000 | $77,900 | $152,100 |
| 2014 | $4,284 | $236,300 | $77,900 | $158,400 |
Source: Public Records
Map
Nearby Homes
- 48 N Belcher Ave
- 72 W Elm Terrace
- 161 Moraine St
- 137 Boylston St
- 15 Byron Ave
- 67 Sycamore Ave Unit 3
- 175 Belmont Ave
- 28 Fern Ave
- 265 Boylston St
- 25 Monson St
- 17 Moraine Place
- 37 West St
- 45 Briarcliff Rd
- 282 Belmont St
- 60 Elm Ave
- 190 Highland St
- 50 Manomet St
- 281 Spring St
- 227 W Elm St Unit 3
- 124 Manomet St