
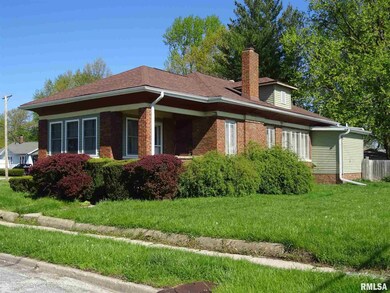

516 W Jefferson St Unit 1 Auburn, IL 62615
Highlights
- Deck
- Fenced Yard
- Bungalow
About This Home
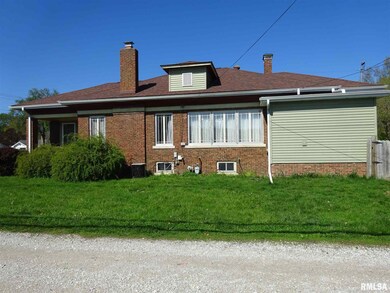
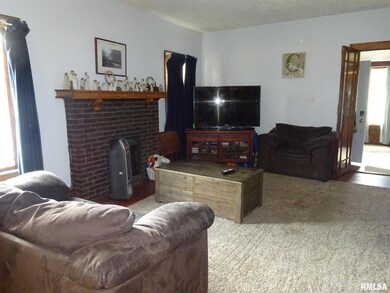
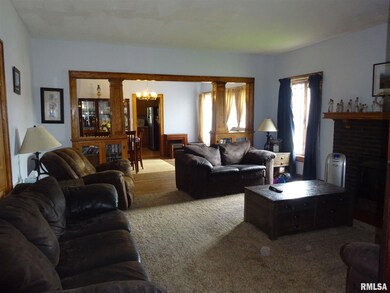
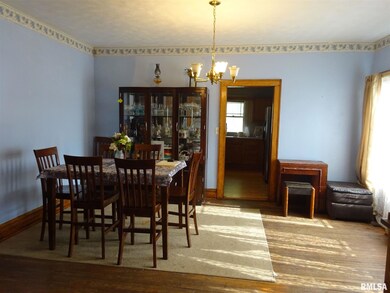
As of August 2021This 2 bedroom, 1 bathroom brick bungalow has a lot of original charm. Home features hardwood floors, trim, and built ins. Updates include kitchen cabinets, stainless appliances, roof in 2013, furnace in 2008, some vinyl windows and updated bathroom with ceramic floors. We are not perfect, but a great brick bungalow with basement and large rooms. Priced to sell for someone looking for a project to build some sweat equity. Inspections welcome, home sold as-is.
Last Buyer's Agent
DEBORAH LADAGE
IN BETWEEN OFFICES License #475160657
Home Details
Home Type
- Single Family
Est. Annual Taxes
- $1,296
Year Built
- Built in 1954
Home Design
- Bungalow
Kitchen
- Oven or Range
- Dishwasher
Additional Features
- Deck
- Fenced Yard
- Cable TV Available
Ownership History
Purchase Details
Home Financials for this Owner
Home Financials are based on the most recent Mortgage that was taken out on this home.Purchase Details
Home Financials for this Owner
Home Financials are based on the most recent Mortgage that was taken out on this home.Purchase Details
Purchase Details
Purchase Details
Map
Home Values in the Area
Average Home Value in this Area
Purchase History
| Date | Type | Sale Price | Title Company |
|---|---|---|---|
| Warranty Deed | $139,000 | Prairie Land Title | |
| Warranty Deed | $52,000 | Prairie Land Title | |
| Deed | -- | -- | |
| Deed | $73,000 | -- | |
| Deed | $47,500 | -- |
Property History
| Date | Event | Price | Change | Sq Ft Price |
|---|---|---|---|---|
| 08/13/2021 08/13/21 | Sold | $139,000 | 0.0% | $91 / Sq Ft |
| 07/23/2021 07/23/21 | Pending | -- | -- | -- |
| 07/21/2021 07/21/21 | For Sale | $139,000 | +167.3% | $91 / Sq Ft |
| 05/29/2020 05/29/20 | Sold | $52,000 | +0.2% | $34 / Sq Ft |
| 05/07/2020 05/07/20 | Pending | -- | -- | -- |
| 05/04/2020 05/04/20 | For Sale | $51,900 | -- | $34 / Sq Ft |
Tax History
| Year | Tax Paid | Tax Assessment Tax Assessment Total Assessment is a certain percentage of the fair market value that is determined by local assessors to be the total taxable value of land and additions on the property. | Land | Improvement |
|---|---|---|---|---|
| 2023 | $1,900 | $30,953 | $6,635 | $24,318 |
| 2022 | $1,781 | $29,306 | $6,282 | $23,024 |
| 2021 | $1,736 | $28,144 | $6,033 | $22,111 |
| 2020 | $1,364 | $28,046 | $6,012 | $22,034 |
| 2019 | $1,327 | $27,351 | $5,863 | $21,488 |
| 2018 | $1,296 | $26,786 | $5,742 | $21,044 |
| 2017 | $1,285 | $25,793 | $5,529 | $20,264 |
| 2016 | $1,233 | $25,631 | $5,494 | $20,137 |
| 2015 | $1,248 | $25,332 | $5,430 | $19,902 |
| 2014 | $1,253 | $25,725 | $5,514 | $20,211 |
| 2013 | $1,130 | $24,879 | $5,333 | $19,546 |
Source: RMLS Alliance
MLS Number: RMACA999525
APN: 34-10.0-213-007
Disclaimer: Certain information contained herein is derived from information provided by parties other than Homes.com. All information provided is deemed reliable, but is not guaranteed to be accurate and should be independently verified.
![]() IDX information is provided exclusively for personal, non-commercial use, and may not be used for any purpose other than to identify prospective properties consumers may be interested in purchasing. Information is deemed reliable but not guaranteed.
IDX information is provided exclusively for personal, non-commercial use, and may not be used for any purpose other than to identify prospective properties consumers may be interested in purchasing. Information is deemed reliable but not guaranteed.
- 716 W Monroe St Unit 1
- 511 N 5th St Unit 1
- 520 N 6th St Unit 1
- 921 W Monroe St Unit 1
- 427 N 10th St
- 890 W Van Buren St
- 1020 W Adams St Unit 1
- 342 Interurban St
- 406 E Washington St
- 14594 Dixon Rd Unit 1
- 1390 Horse Farm Rd
- 11910 Bubbling Well Rd Unit 1
- 222 W Madison Unit 1
- 41 Covered Bridge Acres Unit 1
- 125 Kodiak Dr
- 60 Covered Bridge Acres
- 424 S Lincoln St Unit 1
- 615 Henrietta
- 0 State Route 4
- 42 Buckingham Rd Unit 1