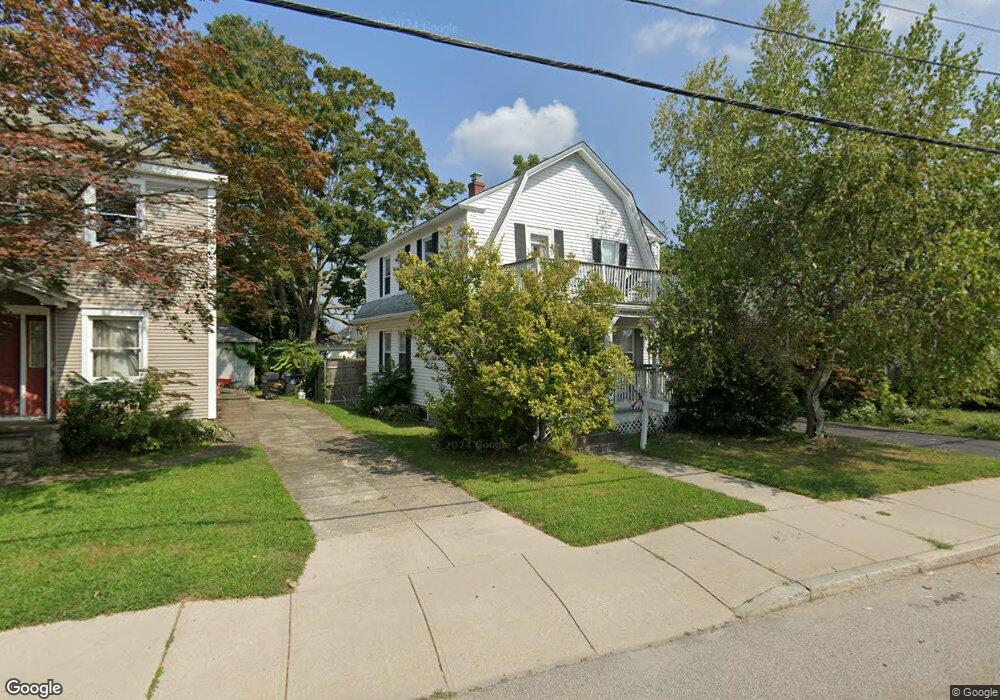
516 Willett Ave Riverside, RI 02915
Riverside NeighborhoodEstimated Value: $423,000 - $456,000
3
Beds
1
Bath
1,360
Sq Ft
$321/Sq Ft
Est. Value
About This Home
This home is located at 516 Willett Ave, Riverside, RI 02915 and is currently estimated at $436,816, approximately $321 per square foot. 516 Willett Ave is a home located in Providence County with nearby schools including East Providence High School, St Mary Academy-Bay View, and St Luke Elementary School.
Ownership History
Date
Name
Owned For
Owner Type
Purchase Details
Closed on
Sep 7, 2011
Sold by
Fhlmc
Bought by
Moakler Kirk
Current Estimated Value
Home Financials for this Owner
Home Financials are based on the most recent Mortgage that was taken out on this home.
Original Mortgage
$111,100
Interest Rate
5.5%
Mortgage Type
FHA
Purchase Details
Closed on
Aug 2, 2011
Sold by
Morton Keith P and Peterson Deena
Bought by
Fhlmc
Home Financials for this Owner
Home Financials are based on the most recent Mortgage that was taken out on this home.
Original Mortgage
$111,100
Interest Rate
5.5%
Mortgage Type
FHA
Purchase Details
Closed on
Apr 1, 2005
Sold by
Walter Richard and Walter Roseann M
Bought by
Peterson Deena
Purchase Details
Closed on
Aug 30, 2000
Sold by
Cookson Richard
Bought by
Walter Richard S and Walter Roseann
Purchase Details
Closed on
Aug 3, 1999
Sold by
Gervais Ardis M
Bought by
Cookson Richard
Create a Home Valuation Report for This Property
The Home Valuation Report is an in-depth analysis detailing your home's value as well as a comparison with similar homes in the area
Home Values in the Area
Average Home Value in this Area
Purchase History
| Date | Buyer | Sale Price | Title Company |
|---|---|---|---|
| Moakler Kirk | -- | -- | |
| Fhlmc | $145,000 | -- | |
| Peterson Deena | $227,000 | -- | |
| Walter Richard S | $105,000 | -- | |
| Cookson Richard | $95,500 | -- | |
| Moakler Kirk | -- | -- | |
| Fhlmc | $145,000 | -- | |
| Peterson Deena | $227,000 | -- | |
| Walter Richard S | $105,000 | -- | |
| Cookson Richard | $95,500 | -- |
Source: Public Records
Mortgage History
| Date | Status | Borrower | Loan Amount |
|---|---|---|---|
| Open | Cookson Richard | $106,328 | |
| Closed | Cookson Richard | $111,100 |
Source: Public Records
Tax History Compared to Growth
Tax History
| Year | Tax Paid | Tax Assessment Tax Assessment Total Assessment is a certain percentage of the fair market value that is determined by local assessors to be the total taxable value of land and additions on the property. | Land | Improvement |
|---|---|---|---|---|
| 2025 | $4,815 | $368,400 | $83,000 | $285,400 |
| 2024 | $4,469 | $291,500 | $69,200 | $222,300 |
| 2023 | $4,303 | $291,500 | $69,200 | $222,300 |
| 2022 | $4,140 | $189,400 | $43,400 | $146,000 |
| 2021 | $4,072 | $189,400 | $42,400 | $147,000 |
| 2020 | $3,900 | $189,400 | $42,400 | $147,000 |
| 2019 | $3,792 | $189,400 | $42,400 | $147,000 |
| 2018 | $3,906 | $170,700 | $45,500 | $125,200 |
| 2017 | $3,819 | $170,700 | $45,500 | $125,200 |
| 2016 | $3,800 | $170,700 | $45,500 | $125,200 |
| 2015 | $4,041 | $176,100 | $44,400 | $131,700 |
| 2014 | $4,041 | $176,100 | $44,400 | $131,700 |
Source: Public Records
Map
Nearby Homes
- 536 Willett Ave
- 25 Read St
- 25 Woodbine St
- 57 Harris St
- 36 Woodbine St
- 25 Winslow St
- 735 Willett Ave Unit 806
- 25 Arnold St
- 81 Sprague Ave
- 151 Willett Ave Unit 2
- 151 Willett Ave Unit 5
- 17 Oak Ave
- 33 Pine St Unit 35
- 146 Becker Ave
- 83 Pine Crest Dr
- 81 Pine Crest Dr
- 1 Holly St
- 1 Fales St
- 88 Lincoln Ave
- 6 Hilton Ave
- 524 Willett Ave
- 512 Willett Ave
- 2 Somerset Ave
- 506 Willett Ave
- 532 Willett Ave
- 521 Willett Ave
- 525 Willett Ave
- 18 Somerset Ave
- 9 Somerset Ave
- 9 Pearce Ave
- 529 Willett Ave
- 493 Willett Ave
- 17 Somerset Ave
- 10 Elinora St
- 6 Pearce Ave
- 487 Willett Ave
- 22 Somerset Ave
- 15 Pearce Ave
- 547 Willett Ave
- 9 Harvey Ave