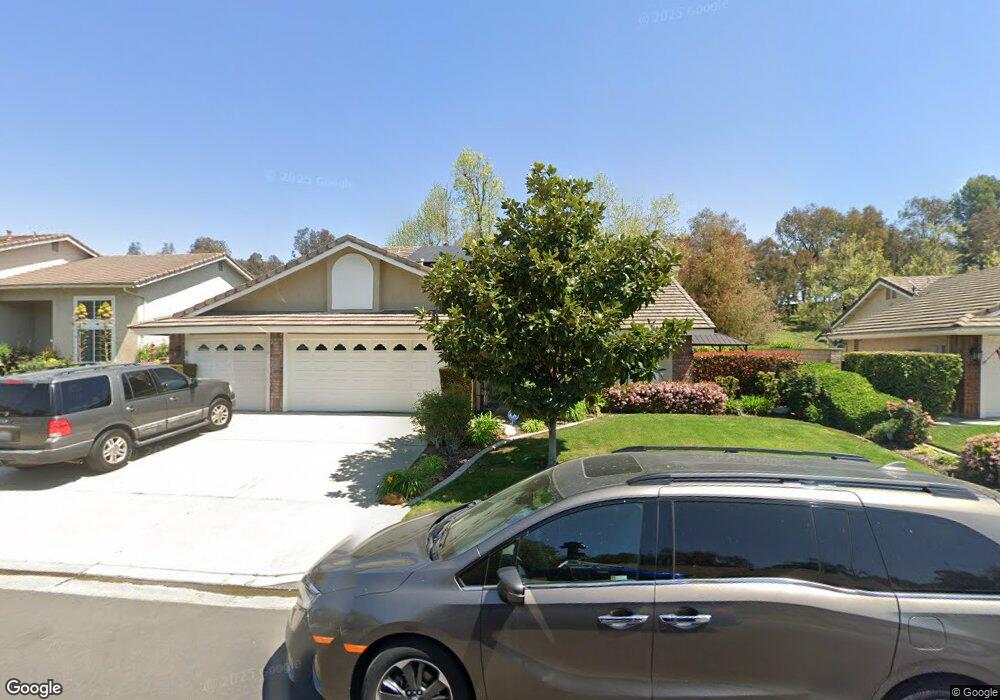
5162 Via Marcos Yorba Linda, CA 92887
Estimated Value: $1,435,017 - $1,591,000
3
Beds
3
Baths
2,224
Sq Ft
$674/Sq Ft
Est. Value
About This Home
This home is located at 5162 Via Marcos, Yorba Linda, CA 92887 and is currently estimated at $1,498,754, approximately $673 per square foot. 5162 Via Marcos is a home located in Orange County with nearby schools including Travis Ranch Middle School, Ivycrest Montessori Private School - Yorba Linda, and Friends Christian School.
Ownership History
Date
Name
Owned For
Owner Type
Purchase Details
Closed on
Nov 24, 2014
Sold by
Shook William and Shook Ginette
Bought by
William & Ginette Shook Trust
Current Estimated Value
Home Financials for this Owner
Home Financials are based on the most recent Mortgage that was taken out on this home.
Original Mortgage
$450,000
Outstanding Balance
$343,311
Interest Rate
3.89%
Mortgage Type
New Conventional
Estimated Equity
$1,155,443
Purchase Details
Closed on
Jun 26, 2008
Sold by
Shook William H and Shook Ginette M
Bought by
Shook William Hanley and Shook Ginette Marie
Purchase Details
Closed on
Jun 19, 1995
Sold by
Kollmar Robert A and Kollmar Susan C
Bought by
Shook William H and Shook Ginette M
Home Financials for this Owner
Home Financials are based on the most recent Mortgage that was taken out on this home.
Original Mortgage
$200,000
Interest Rate
7.83%
Create a Home Valuation Report for This Property
The Home Valuation Report is an in-depth analysis detailing your home's value as well as a comparison with similar homes in the area
Home Values in the Area
Average Home Value in this Area
Purchase History
| Date | Buyer | Sale Price | Title Company |
|---|---|---|---|
| William & Ginette Shook Trust | -- | Accommodation | |
| Shook William | -- | Lawyers Title | |
| Shook William Hanley | -- | None Available | |
| Shook William H | $279,500 | Guardian Title Company |
Source: Public Records
Mortgage History
| Date | Status | Borrower | Loan Amount |
|---|---|---|---|
| Open | Shook William | $450,000 | |
| Previous Owner | Shook William H | $200,000 |
Source: Public Records
Tax History Compared to Growth
Tax History
| Year | Tax Paid | Tax Assessment Tax Assessment Total Assessment is a certain percentage of the fair market value that is determined by local assessors to be the total taxable value of land and additions on the property. | Land | Improvement |
|---|---|---|---|---|
| 2025 | $5,630 | $464,313 | $170,335 | $293,978 |
| 2024 | $5,630 | $455,209 | $166,995 | $288,214 |
| 2023 | $5,479 | $446,284 | $163,721 | $282,563 |
| 2022 | $5,076 | $437,534 | $160,511 | $277,023 |
| 2021 | $4,985 | $428,955 | $157,363 | $271,592 |
| 2020 | $4,832 | $424,557 | $155,749 | $268,808 |
| 2019 | $4,646 | $416,233 | $152,695 | $263,538 |
| 2018 | $4,708 | $408,072 | $149,701 | $258,371 |
| 2017 | $4,536 | $400,071 | $146,766 | $253,305 |
| 2016 | $4,404 | $392,227 | $143,888 | $248,339 |
| 2015 | $4,469 | $386,336 | $141,727 | $244,609 |
| 2014 | $4,274 | $378,769 | $138,951 | $239,818 |
Source: Public Records
Map
Nearby Homes
- 5317 Via Ramon Rd
- 20709 Calle Pera
- 20660 Calle Feliz
- 21620 Brisbane Way
- 21630 Dunrobin Way
- 5795 Via Perla
- 5851 Via Santana
- 5505 Calle Vista Linda
- 20681 Via Amarilla
- 4811 Rideline Rd
- 20455 Via Cadiz
- 5810 34 Via Romero
- 21417 Zaca Ct
- 5685 Avenida Florencia
- 5000 Stonehaven Dr
- 21590 Via Pepita
- 20754 Tulip Cir
- 21451 Cloud Ridge
- 20640 Smoketree Ave
- 21395 Via Del Lobo
- 5152 Via Marcos
- 5172 Via Marcos
- 5142 Via Marcos
- 5182 Via Marcos
- 5161 Via Marcos
- 5171 Via Marcos
- 5181 Via Marcos
- 5151 Via Marcos
- 5132 Via Marcos
- 5192 Via Marcos
- 21097 Carlos Rd
- 5131 Via Marcos
- 5122 Via Marcos
- 5141 Via Marcos
- 21101 Carlos Rd
- 21095 Carlos Rd
- 21091 Carlos Rd
- 21107 Carlos Rd
- 5121 Via Marcos
- 5112 Via Marcos