M
Seller's Agent in 2026
My Smart Team
Production Realty
(517) 295-3948
98 Total Sales
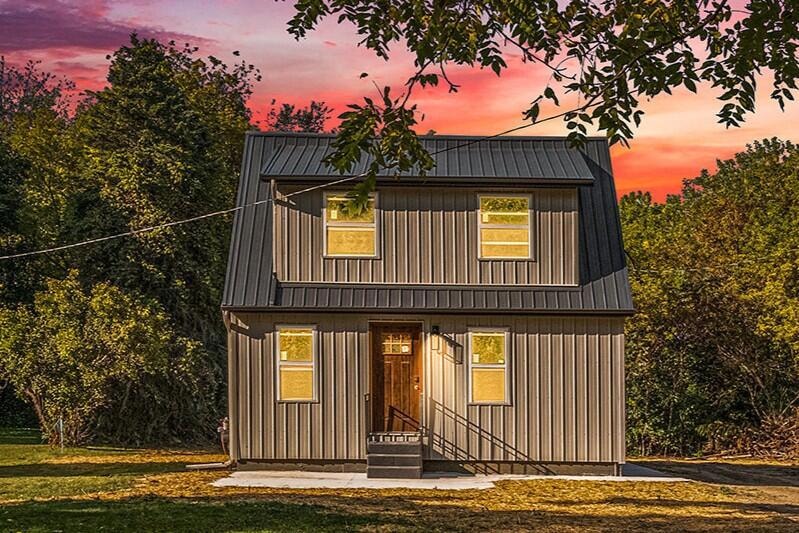


This beautifully reimagined 4-bedroom, 2.5-bath home offers over 1,500 sq. ft. of thoughtfully designed living space. Taken down to the studs, the home features a brand-new floor plan, new siding, new roof, new doors and windows, new plumbing, new electrical, and an added garage with expanded upper-level living space. Currently still under renovation, buyers have the rare opportunity to choose finishing touches and truly make it their own. Outside, the property offers a fresh slate for landscaping—perfect for creating your ideal outdoor retreat. With modern updates throughout and room to add your personal style, this home is a one-of-a-kind opportunity you won't want to miss!
Last Agent to Sell the Property
Production Realty License #00000000 Listed on: 09/18/2025
| Date | Type | Sale Price | Title Company |
|---|---|---|---|
| Interfamily Deed Transfer | -- | None Available | |
| Interfamily Deed Transfer | -- | None Available | |
| Quit Claim Deed | $5,000 | None Available | |
| Quit Claim Deed | -- | None Available | |
| Interfamily Deed Transfer | -- | None Available | |
| Interfamily Deed Transfer | -- | -- | |
| Interfamily Deed Transfer | $5,000 | -- | |
| Quit Claim Deed | -- | -- | |
| Warranty Deed | -- | -- | |
| Interfamily Deed Transfer | $1,000 | First American Title Ins Co | |
| Warranty Deed | $10,000 | -- |
| Date | Event | Price | List to Sale | Price per Sq Ft |
|---|---|---|---|---|
| 01/06/2026 01/06/26 | Sold | $170,000 | -47.2% | $110 / Sq Ft |
| 12/19/2025 12/19/25 | Pending | -- | -- | -- |
| 12/12/2025 12/12/25 | Price Changed | $322,000 | -3.9% | $209 / Sq Ft |
| 09/18/2025 09/18/25 | For Sale | $335,000 | -- | $218 / Sq Ft |
| Year | Tax Paid | Tax Assessment Tax Assessment Total Assessment is a certain percentage of the fair market value that is determined by local assessors to be the total taxable value of land and additions on the property. | Land | Improvement |
|---|---|---|---|---|
| 2025 | $613 | $24,000 | $0 | $0 |
| 2024 | $3 | $23,300 | $0 | $0 |
| 2023 | $174 | $19,000 | $0 | $0 |
| 2022 | $556 | $19,600 | $0 | $0 |
| 2021 | $547 | $19,720 | $0 | $0 |
| 2020 | $540 | $16,560 | $0 | $0 |
| 2019 | $513 | $15,930 | $0 | $0 |
| 2018 | $512 | $16,000 | $5,690 | $10,310 |
| 2017 | $464 | $15,970 | $0 | $0 |
| 2016 | $148 | $16,000 | $16,000 | $0 |
| 2015 | $12,933 | $14,430 | $14,430 | $0 |
| 2014 | $12,933 | $13,340 | $0 | $0 |
| 2013 | -- | $13,340 | $13,340 | $0 |
M
Seller's Agent in 2026
My Smart Team
Production Realty
(517) 295-3948
98 Total Sales

Seller Co-Listing Agent in 2026
Ben Kono
Production Realty
(517) 917-5550
76 Total Sales
Buyer's Agent in 2026
Rich Cook
ERA REARDON REALTY, L.L.C.
(517) 474-7424
235 Total Sales
Source: MichRIC
MLS Number: 25048009
APN: 095-12-23-426-024-00
Disclaimer: Certain information contained herein is derived from information provided by parties other than Homes.com. All information provided is deemed reliable, but is not guaranteed to be accurate and should be independently verified.
![]() Information is deemed reliable but not guaranteed.
Information is deemed reliable but not guaranteed.
Copyright 2026 MichRIC, LLC. All rights reserved.
Ask me questions while you tour the home.