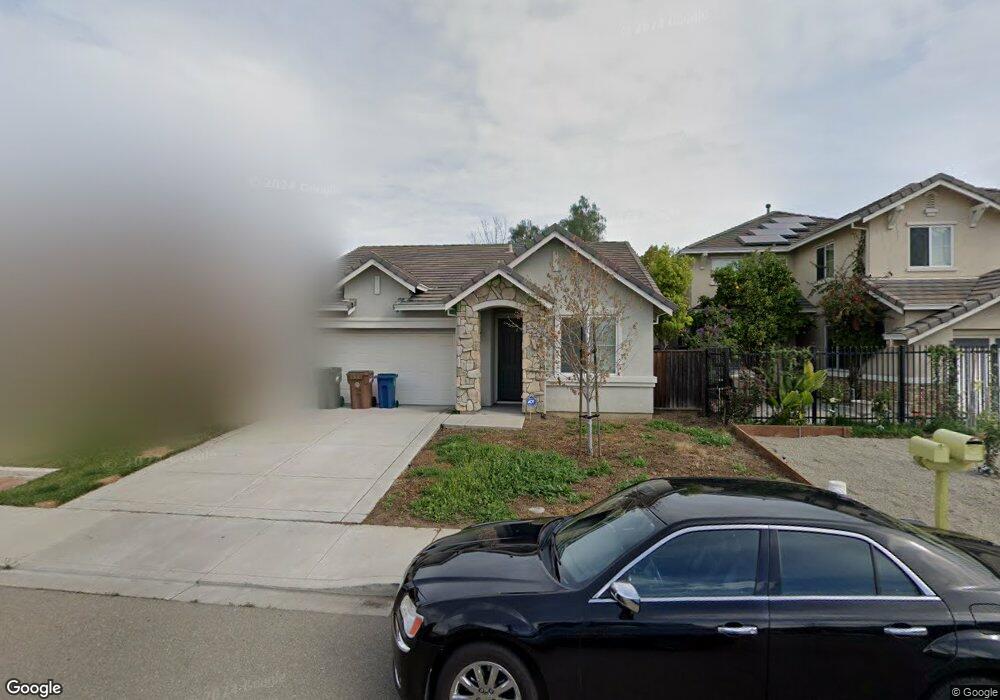
5165 Deerspring Way Antioch, CA 94531
Lone Tree Valley NeighborhoodEstimated Value: $569,000 - $611,000
3
Beds
2
Baths
1,603
Sq Ft
$368/Sq Ft
Est. Value
About This Home
This home is located at 5165 Deerspring Way, Antioch, CA 94531 and is currently estimated at $589,799, approximately $367 per square foot. 5165 Deerspring Way is a home located in Contra Costa County with nearby schools including Diablo Vista Elementary School, Dallas Ranch Middle School, and Deer Valley High School.
Ownership History
Date
Name
Owned For
Owner Type
Purchase Details
Closed on
Aug 20, 2008
Sold by
Vangogh Alethen J R
Bought by
Vangogh Joseph E
Current Estimated Value
Home Financials for this Owner
Home Financials are based on the most recent Mortgage that was taken out on this home.
Original Mortgage
$188,000
Outstanding Balance
$122,904
Interest Rate
6.25%
Mortgage Type
Purchase Money Mortgage
Estimated Equity
$466,895
Purchase Details
Closed on
Aug 7, 2008
Sold by
Engleman Adam
Bought by
Vangogh Joseph E
Home Financials for this Owner
Home Financials are based on the most recent Mortgage that was taken out on this home.
Original Mortgage
$188,000
Outstanding Balance
$122,904
Interest Rate
6.25%
Mortgage Type
Purchase Money Mortgage
Estimated Equity
$466,895
Purchase Details
Closed on
Aug 23, 2006
Sold by
West Coast Home Builders Inc
Bought by
Engleman Adam
Home Financials for this Owner
Home Financials are based on the most recent Mortgage that was taken out on this home.
Original Mortgage
$417,000
Interest Rate
6.37%
Mortgage Type
Negative Amortization
Create a Home Valuation Report for This Property
The Home Valuation Report is an in-depth analysis detailing your home's value as well as a comparison with similar homes in the area
Home Values in the Area
Average Home Value in this Area
Purchase History
| Date | Buyer | Sale Price | Title Company |
|---|---|---|---|
| Vangogh Joseph E | -- | Accommodation | |
| Vangogh Joseph E | $235,000 | Stewart Title | |
| Engleman Adam | $524,500 | Old Republic Title Company |
Source: Public Records
Mortgage History
| Date | Status | Borrower | Loan Amount |
|---|---|---|---|
| Open | Vangogh Joseph E | $188,000 | |
| Previous Owner | Engleman Adam | $417,000 |
Source: Public Records
Tax History Compared to Growth
Tax History
| Year | Tax Paid | Tax Assessment Tax Assessment Total Assessment is a certain percentage of the fair market value that is determined by local assessors to be the total taxable value of land and additions on the property. | Land | Improvement |
|---|---|---|---|---|
| 2025 | $3,857 | $302,606 | $64,379 | $238,227 |
| 2024 | $3,687 | $296,673 | $63,117 | $233,556 |
| 2023 | $3,687 | $290,857 | $61,880 | $228,977 |
| 2022 | $3,635 | $285,155 | $60,667 | $224,488 |
| 2021 | $3,529 | $279,565 | $59,478 | $220,087 |
| 2019 | $3,444 | $271,275 | $57,715 | $213,560 |
| 2018 | $3,318 | $265,957 | $56,584 | $209,373 |
| 2017 | $3,249 | $260,743 | $55,475 | $205,268 |
| 2016 | $3,166 | $255,632 | $54,388 | $201,244 |
| 2015 | $3,332 | $251,794 | $53,572 | $198,222 |
| 2014 | $4,060 | $246,863 | $52,523 | $194,340 |
Source: Public Records
Map
Nearby Homes
- 5004 Havenrock Ct
- 5124 Longdale Ct
- 5447 Benttree Way
- 5437 Prewett Ranch Dr
- 5213 Walker Ct
- 5611 Trinity Lakes Ln
- 5305 Cardinal St
- 5337 Cardinal St
- 5305 McDowell Valley Ln
- 5115 Equestrian Ct
- 5132 Pioneer Way
- 4866 Vinewood Way
- 5165 Hereford Way
- 5390 Shenandoah Valley Ln
- 5485 Spring Mountain Ln
- 2457 Mojave Dr
- 5041 Wagon Wheel Way
- 5536 Pinnacle View Ct
- 5052 Perry Way
- 5017 Perry Way
- 5169 Deerspring Way
- 5161 Deerspring Way
- 5173 Deerspring Way
- 5157 Deerspring Way
- 5177 Deerspring Way
- 5153 Deerspring Way
- 5200 Rainwood Way
- 5149 Deerspring Way
- 5201 Star Thistle Way
- 5201 Rainwood Way
- 5204 Rainwood Way
- 5003 Havenrock Ct
- 5005 Havenrock Ct
- 5145 Deerspring Way
- 5001 Havenrock Ct
- 5205 Rainwood Way
- 5205 Star Thistle Way
- 5208 Rainwood Way
- 5200 Sungrove Way
- 5141 Deerspring Way