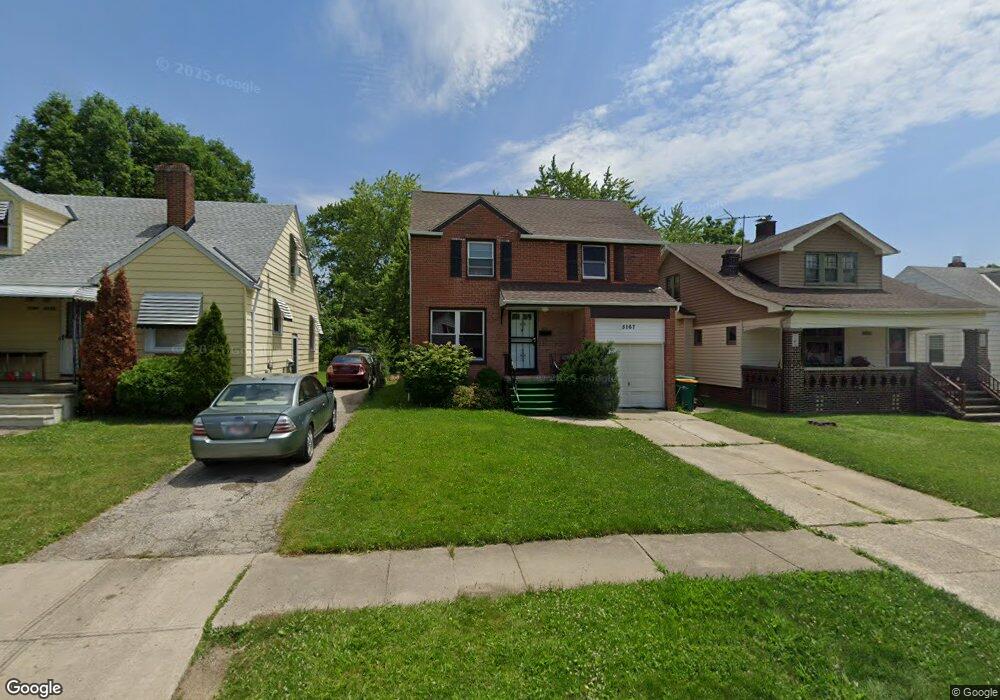
5167 Philip Ave Maple Heights, OH 44137
Estimated Value: $116,048 - $123,000
3
Beds
1
Bath
1,294
Sq Ft
$93/Sq Ft
Est. Value
About This Home
This home is located at 5167 Philip Ave, Maple Heights, OH 44137 and is currently estimated at $120,512, approximately $93 per square foot. 5167 Philip Ave is a home located in Cuyahoga County with nearby schools including Abraham Lincoln Elementary School, Rockside/ J.F. Kennedy School, and Italy High School.
Ownership History
Date
Name
Owned For
Owner Type
Purchase Details
Closed on
Apr 10, 2011
Sold by
Olorode Grace E and Ogor Lucky
Bought by
Ogor Enterpises Inc
Current Estimated Value
Purchase Details
Closed on
Apr 28, 2010
Sold by
Secretary Of Housing & Urban Development
Bought by
Olorode Grace E
Purchase Details
Closed on
Jan 22, 2008
Sold by
Tumino Michael A
Bought by
Hud
Purchase Details
Closed on
Sep 12, 2001
Sold by
Tumino Trust Tumino, Christine 1/2 Trs Christ
Bought by
Tumino Michael A
Home Financials for this Owner
Home Financials are based on the most recent Mortgage that was taken out on this home.
Original Mortgage
$70,725
Interest Rate
7.03%
Mortgage Type
FHA
Purchase Details
Closed on
May 22, 1999
Sold by
Tumino Christine
Bought by
Tumino Christine
Purchase Details
Closed on
Apr 11, 1990
Sold by
Tumino Joe and Tumino Christine
Bought by
Tumino Christine
Purchase Details
Closed on
Jan 1, 1975
Bought by
Tumino Joe and Tumino Christine
Create a Home Valuation Report for This Property
The Home Valuation Report is an in-depth analysis detailing your home's value as well as a comparison with similar homes in the area
Home Values in the Area
Average Home Value in this Area
Purchase History
| Date | Buyer | Sale Price | Title Company |
|---|---|---|---|
| Ogor Enterpises Inc | -- | Attorney | |
| Olorode Grace E | -- | Lakeside Title | |
| Hud | $38,667 | Attorney | |
| Tumino Michael A | $71,700 | Quality Title Agency Inc | |
| Tumino Christine | -- | Midland Title Security Inc | |
| Tumino Christine | -- | -- | |
| Tumino Joe | -- | -- |
Source: Public Records
Mortgage History
| Date | Status | Borrower | Loan Amount |
|---|---|---|---|
| Previous Owner | Tumino Michael A | $70,725 |
Source: Public Records
Tax History Compared to Growth
Tax History
| Year | Tax Paid | Tax Assessment Tax Assessment Total Assessment is a certain percentage of the fair market value that is determined by local assessors to be the total taxable value of land and additions on the property. | Land | Improvement |
|---|---|---|---|---|
| 2024 | $3,335 | $36,225 | $7,140 | $29,085 |
| 2023 | $2,120 | $18,940 | $4,340 | $14,600 |
| 2022 | $2,113 | $18,940 | $4,340 | $14,600 |
| 2021 | $2,250 | $18,940 | $4,340 | $14,600 |
| 2020 | $1,929 | $14,350 | $3,290 | $11,060 |
| 2019 | $1,919 | $41,000 | $9,400 | $31,600 |
| 2018 | $1,748 | $14,350 | $3,290 | $11,060 |
| 2017 | $1,495 | $12,360 | $3,010 | $9,350 |
| 2016 | $1,666 | $12,360 | $3,010 | $9,350 |
| 2015 | $2,937 | $12,360 | $3,010 | $9,350 |
| 2014 | $2,937 | $16,110 | $3,330 | $12,780 |
Source: Public Records
Map
Nearby Homes
- 5110 Philip Ave
- 5231 Philip Ave
- 5185 Clement Ave
- 5082 Philip Ave
- 5257 Philip Ave
- 5061 Philip Ave
- 5208 Clement Ave
- 5212 Catherine St
- 5199 Arch St
- 5239 Arch St
- 5031 Cato St
- 5234 Erwin St
- 5320 Clement Ave
- 5210 Theodore St
- 17916 North Blvd
- 17912 North Blvd
- 17806 Maple Heights Blvd
- 17204 Maple Heights Blvd
- 5425 Grasmere Ave
- 16712 Kollin Ave
- 5163 Philip Ave
- 5171 Philip Ave
- 5173 Philip Ave
- 5157 Philip Ave
- 5177 Philip Ave
- 5166 Thomas St
- 5162 Thomas St
- 5170 Thomas St
- 5158 Thomas St
- 5151 Philip Ave
- 5174 Thomas St
- 5181 Philip Ave
- 5154 Thomas St
- 5178 Thomas St
- 5166 Philip Ave
- 5162 Philip Ave
- 5170 Philip Ave
- 5147 Philip Ave
- 5174 Philip Ave
- 5158 Philip Ave