Estimated Value: $427,000 - $519,000
5
Beds
2
Baths
1,553
Sq Ft
$305/Sq Ft
Est. Value
About This Home
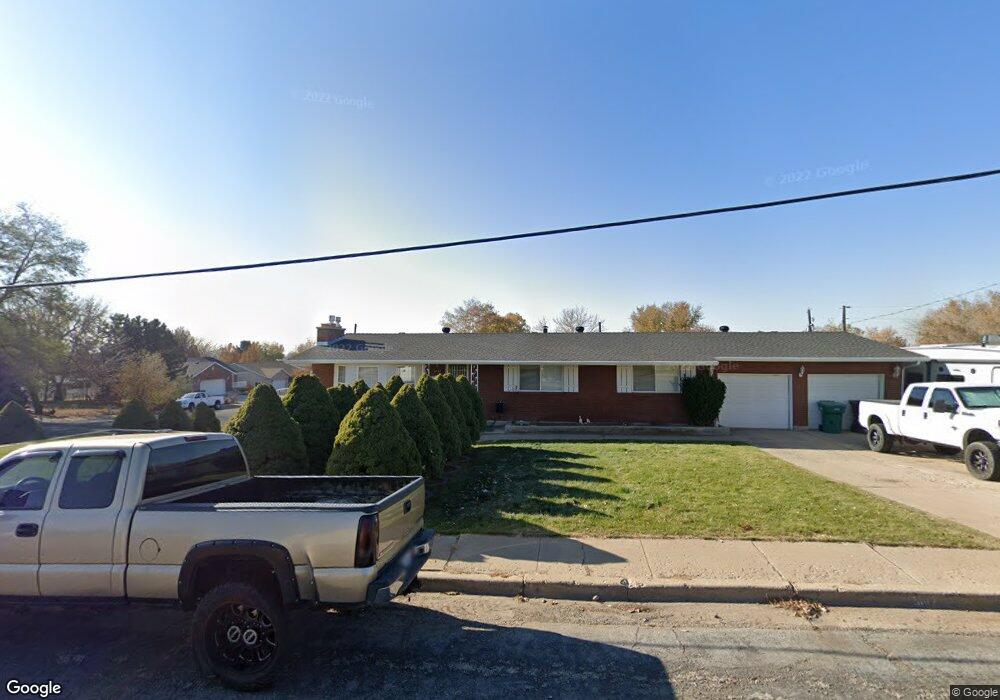
This home is located at 5167 S 2500 W, Roy, UT 84067 and is currently estimated at $473,516, approximately $304 per square foot. 5167 S 2500 W is a home located in Weber County with nearby schools including Lakeview Elementary School, Roy Junior High School, and Roy High School.
Ownership History
Date
Name
Owned For
Owner Type
Purchase Details
Closed on
Jan 15, 2025
Sold by
Field Kent Seifert
Bought by
Seifert Field Kent and Brooke Field Lindsey
Current Estimated Value
Purchase Details
Closed on
Mar 14, 2012
Sold by
Field Christi A
Bought by
Field Kent Seifert
Create a Home Valuation Report for This Property
The Home Valuation Report is an in-depth analysis detailing your home's value as well as a comparison with similar homes in the area
Home Values in the Area
Average Home Value in this Area
Purchase History
| Date | Buyer | Sale Price | Title Company |
|---|---|---|---|
| Seifert Field Kent | -- | None Listed On Document | |
| Seifert Field Kent | -- | None Listed On Document | |
| Field Kent Seifert | -- | Bonneville Superior Title Co |
Source: Public Records
Tax History Compared to Growth
Tax History
| Year | Tax Paid | Tax Assessment Tax Assessment Total Assessment is a certain percentage of the fair market value that is determined by local assessors to be the total taxable value of land and additions on the property. | Land | Improvement |
|---|---|---|---|---|
| 2025 | $3,171 | $510,232 | $131,670 | $378,562 |
| 2024 | $3,092 | $275,549 | $72,419 | $203,130 |
| 2023 | $2,797 | $248,050 | $67,938 | $180,112 |
| 2022 | $2,869 | $273,350 | $58,184 | $215,166 |
| 2021 | $2,290 | $363,000 | $75,097 | $287,903 |
| 2020 | $2,006 | $294,000 | $75,097 | $218,903 |
| 2019 | $2,069 | $288,000 | $46,237 | $241,763 |
| 2018 | $1,946 | $257,000 | $42,023 | $214,977 |
| 2017 | $1,855 | $232,000 | $42,023 | $189,977 |
| 2016 | $1,642 | $110,929 | $20,145 | $90,784 |
| 2015 | $1,594 | $110,834 | $17,361 | $93,473 |
| 2014 | $1,608 | $110,834 | $17,361 | $93,473 |
Source: Public Records
Map
Nearby Homes