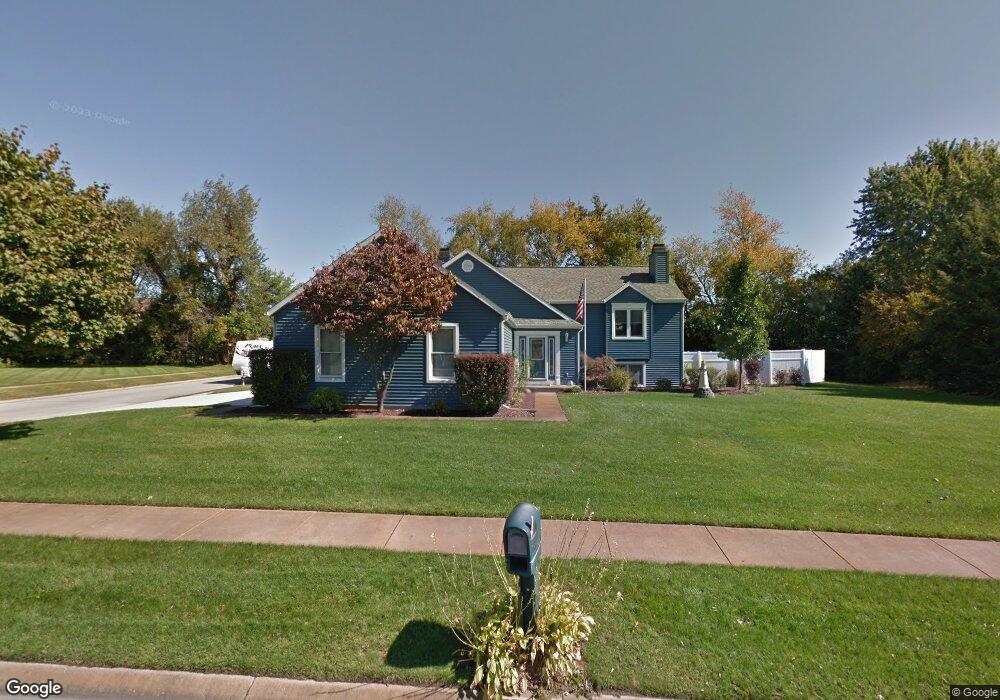
51680 James Lawrence Pkwy Granger, IN 46530
Estimated Value: $423,000 - $525,000
3
Beds
2
Baths
2,884
Sq Ft
$159/Sq Ft
Est. Value
About This Home
This home is located at 51680 James Lawrence Pkwy, Granger, IN 46530 and is currently estimated at $457,689, approximately $158 per square foot. 51680 James Lawrence Pkwy is a home located in St. Joseph County with nearby schools including J.C. Hoglan Elementary School, Northpoint Elementary School, and Discovery Middle School.
Ownership History
Date
Name
Owned For
Owner Type
Purchase Details
Closed on
Feb 8, 2008
Sold by
51680 James Lawrence Land Trust
Bought by
Lustik Thomas J and Lustik Martha A
Current Estimated Value
Home Financials for this Owner
Home Financials are based on the most recent Mortgage that was taken out on this home.
Original Mortgage
$158,000
Interest Rate
6.11%
Mortgage Type
New Conventional
Purchase Details
Closed on
Oct 19, 2007
Sold by
Tcif Reo Cit Llc
Bought by
Tcif Reo Cit Llc
Purchase Details
Closed on
Jan 11, 2006
Sold by
Mckinley Bradley O and Mckinley Alice M
Bought by
Holmes Michaelle M
Home Financials for this Owner
Home Financials are based on the most recent Mortgage that was taken out on this home.
Original Mortgage
$38,550
Interest Rate
6.46%
Mortgage Type
Stand Alone Second
Create a Home Valuation Report for This Property
The Home Valuation Report is an in-depth analysis detailing your home's value as well as a comparison with similar homes in the area
Home Values in the Area
Average Home Value in this Area
Purchase History
| Date | Buyer | Sale Price | Title Company |
|---|---|---|---|
| Lustik Thomas J | -- | None Available | |
| Tcif Reo Cit Llc | -- | Meridian Title | |
| Holmes Michaelle M | -- | Metropolitan Title In Llc |
Source: Public Records
Mortgage History
| Date | Status | Borrower | Loan Amount |
|---|---|---|---|
| Closed | Lustik Thomas J | $158,000 | |
| Previous Owner | Holmes Michaelle M | $38,550 | |
| Previous Owner | Holmes Michaelle M | $154,300 |
Source: Public Records
Tax History Compared to Growth
Tax History
| Year | Tax Paid | Tax Assessment Tax Assessment Total Assessment is a certain percentage of the fair market value that is determined by local assessors to be the total taxable value of land and additions on the property. | Land | Improvement |
|---|---|---|---|---|
| 2024 | $2,659 | $338,100 | $94,800 | $243,300 |
| 2023 | $2,964 | $345,200 | $94,800 | $250,400 |
| 2022 | $2,964 | $351,700 | $94,800 | $256,900 |
| 2021 | $2,346 | $277,900 | $45,400 | $232,500 |
| 2020 | $1,931 | $246,400 | $40,300 | $206,100 |
| 2019 | $1,660 | $223,000 | $36,500 | $186,500 |
| 2018 | $1,673 | $224,800 | $36,200 | $188,600 |
| 2017 | $1,386 | $196,100 | $31,600 | $164,500 |
| 2016 | $1,398 | $196,100 | $31,600 | $164,500 |
| 2014 | $1,464 | $195,500 | $31,600 | $163,900 |
Source: Public Records
Map
Nearby Homes
- 51727 Salem Meadows Lot 15 Dr Unit 15
- 51793 Salem Meadows Lot 18 Dr Unit 18
- 14170 Kline Shores Lot 23 Dr Unit 23
- 14370 State Road 23
- 14770 Fairfield Dr
- 14066 Kline Shores Lot 27 Dr Unit 27
- 14030 Kline Shores Lot 29 Dr Unit 29
- 15731 Indiana 23
- 51405 Elm Rd
- 51216 Leeward Point
- 14988 Bonanza Ct W
- 51399 Waywood Ct
- 51524 Renwick Ct
- 52123 Evard Dr
- 15306 Longford Dr
- 51772 Currant Rd
- 50744 Post Rd
- 52288 Wood Haven Ct
- 15125 Adams Rd
- 50727 Pickett Ridge Ct
- 51656 James Lawrence Pkwy
- 51700 James Lawrence Pkwy
- 51679 Caledonian Dr
- 51701 James Lawrence Pkwy
- 51671 James Lawrence Pkwy
- 51716 James Lawrence Pkwy
- 51641 Caledonian Dr
- 51636 James Lawrence Pkwy
- 51703 Caledonian Dr
- 14499 Skybreeze Dr
- 51647 James Lawrence Pkwy
- 14478 Skybreeze Dr
- 51617 James Lawrence Pkwy
- 51732 James Lawrence Pkwy
- 51616 James Lawrence Pkwy
- 51725 Caledonian Dr
- 14480 Willow Bend Ct
- 14449 Meadow Run Ct
- 14500 Skybreeze Dr
- 14517 Skybreeze Dr