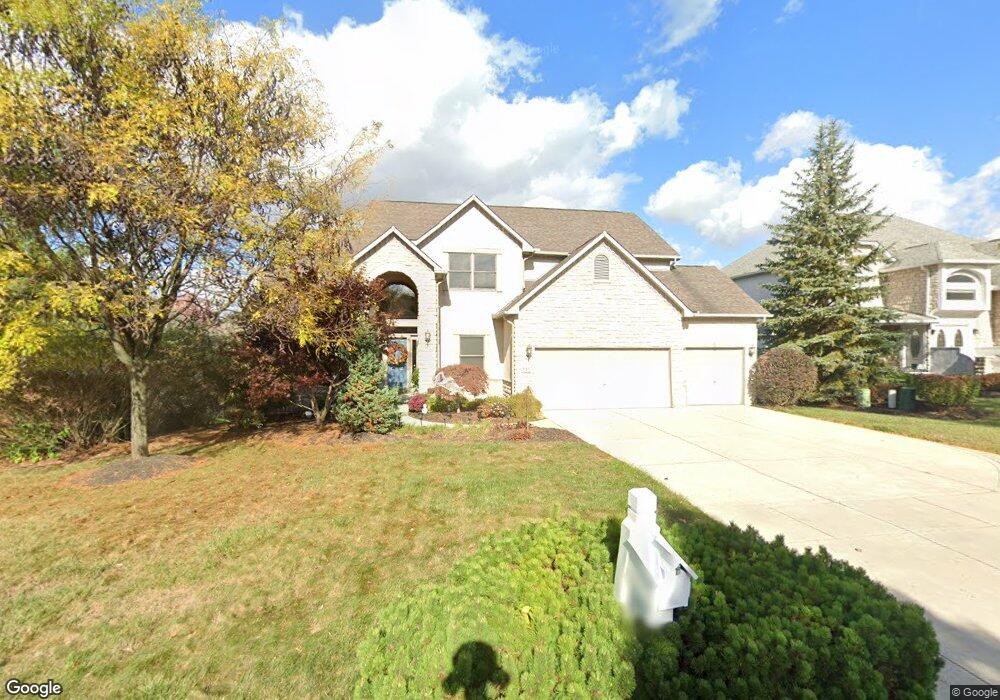
5169 Royal County Down Westerville, OH 43082
Genoa NeighborhoodEstimated Value: $725,426 - $815,000
5
Beds
5
Baths
4,912
Sq Ft
$157/Sq Ft
Est. Value
About This Home
This home is located at 5169 Royal County Down, Westerville, OH 43082 and is currently estimated at $771,857, approximately $157 per square foot. 5169 Royal County Down is a home located in Delaware County with nearby schools including Walnut Creek Elementary School, Berkshire Middle School, and Orange High School.
Ownership History
Date
Name
Owned For
Owner Type
Purchase Details
Closed on
Jun 13, 2011
Sold by
Kotarba Robert D and Kotarba Rene M
Bought by
Erwin Michael S and Erwin Gina E
Current Estimated Value
Home Financials for this Owner
Home Financials are based on the most recent Mortgage that was taken out on this home.
Original Mortgage
$394,250
Outstanding Balance
$272,298
Interest Rate
4.67%
Mortgage Type
New Conventional
Estimated Equity
$499,559
Purchase Details
Closed on
Aug 21, 2003
Sold by
Silvestri Homes Ltd
Bought by
Kotarba Robert D and Kotarba Rene M
Purchase Details
Closed on
Feb 4, 2003
Sold by
Planned Communities Inc
Bought by
Silvestri Homes Ltd
Purchase Details
Closed on
Jan 22, 2003
Sold by
Planned Communities Inc
Bought by
Silvestri Homes Ltd
Create a Home Valuation Report for This Property
The Home Valuation Report is an in-depth analysis detailing your home's value as well as a comparison with similar homes in the area
Home Values in the Area
Average Home Value in this Area
Purchase History
| Date | Buyer | Sale Price | Title Company |
|---|---|---|---|
| Erwin Michael S | $415,000 | Real Living Title | |
| Kotarba Robert D | $385,000 | -- | |
| Silvestri Homes Ltd | $65,280 | -- | |
| Silvestri Homes Ltd | $65,300 | Ohio Title |
Source: Public Records
Mortgage History
| Date | Status | Borrower | Loan Amount |
|---|---|---|---|
| Open | Erwin Michael S | $394,250 |
Source: Public Records
Tax History Compared to Growth
Tax History
| Year | Tax Paid | Tax Assessment Tax Assessment Total Assessment is a certain percentage of the fair market value that is determined by local assessors to be the total taxable value of land and additions on the property. | Land | Improvement |
|---|---|---|---|---|
| 2024 | $11,398 | $198,420 | $41,300 | $157,120 |
| 2023 | $11,352 | $198,420 | $41,300 | $157,120 |
| 2022 | $11,996 | $165,870 | $31,500 | $134,370 |
| 2021 | $12,069 | $165,870 | $31,500 | $134,370 |
| 2020 | $12,122 | $165,870 | $31,500 | $134,370 |
| 2019 | $10,507 | $148,330 | $31,500 | $116,830 |
| 2018 | $10,398 | $148,330 | $31,500 | $116,830 |
| 2017 | $9,649 | $135,800 | $27,160 | $108,640 |
| 2016 | $10,024 | $135,800 | $27,160 | $108,640 |
| 2015 | $9,129 | $135,800 | $27,160 | $108,640 |
| 2014 | $9,028 | $135,800 | $27,160 | $108,640 |
| 2013 | $9,162 | $135,800 | $27,160 | $108,640 |
Source: Public Records
Map
Nearby Homes
- 5694 Piermont Ct
- 4527 McAlister Park Dr
- 5731 Salem Dr
- 4515 McAlister Park Dr
- 5714 Braymoore Dr
- 5748 Edgebrook Dr
- 5542 Troon Place
- 6024 Victory Ln
- 5540 Bellerive Place
- 4960 Hawthorne Valley Dr
- 5114 Thornwood Dr
- 5532 Meadowood Ln
- 6152 Jaycox Rd
- 6206 Garden Loop
- 6384 Garden Loop
- 6192 Garden Loop
- 6398 Garden Loop
- 3902 Rivers Run Dr
- 5349 Slater Ridge Unit 5349
- 5462 Ketterington Ln
- 5149 Royal County Down
- 5187 Royal County Down
- 5124 Manor Ridge Ct
- 5125 Royal County Down
- 5926 Old Head Ct
- 5190 Royal County Down
- 5927 Old Head Ct
- 5104 Manor Ridge Ct
- 5936 Old Head Ct
- 5099 Royal County Down
- 5882 Highland Hills Dr
- 5855 Highland Hills Dr
- 5861 Highland Hills Dr
- 5135 Manor Ridge Ct
- 5845 Highland Hills Dr
- 5937 Old Head Ct
- 5867 Highland Hills Dr
- 5974 Aberfeldy Ct
- 5109 Manor Ridge Ct
- 5082 Manor Ridge Ct