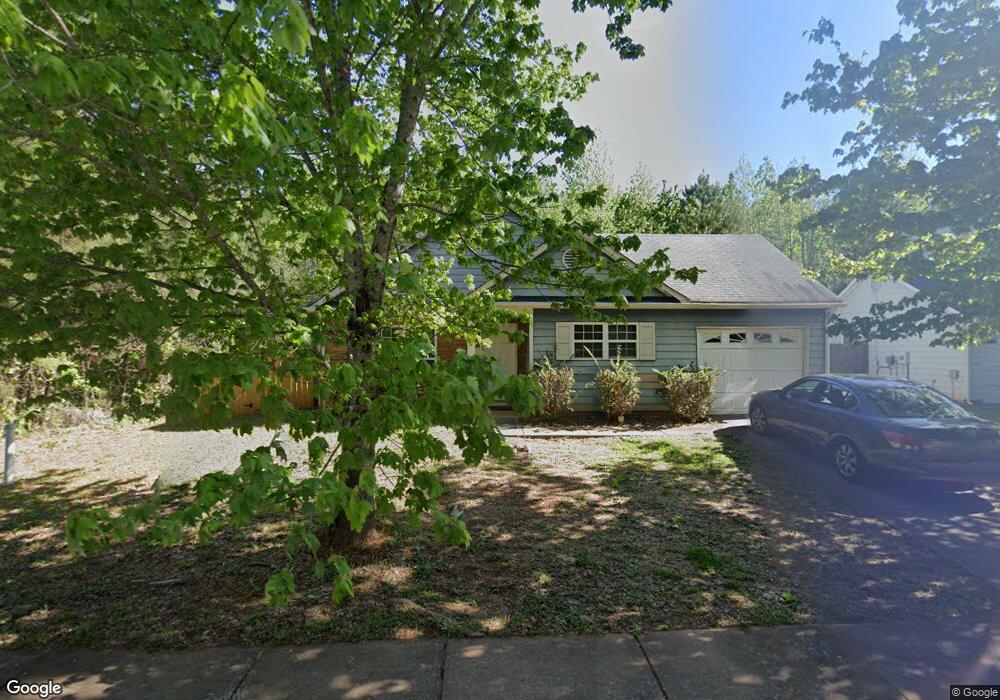
5169 Tew Ln SW Covington, GA 30014
Estimated Value: $206,000 - $246,000
3
Beds
2
Baths
1,680
Sq Ft
$134/Sq Ft
Est. Value
About This Home
This home is located at 5169 Tew Ln SW, Covington, GA 30014 and is currently estimated at $224,784, approximately $133 per square foot. 5169 Tew Ln SW is a home located in Newton County with nearby schools including Porterdale Elementary School, Clements Middle School, and Eastside High School.
Ownership History
Date
Name
Owned For
Owner Type
Purchase Details
Closed on
Jan 18, 2022
Sold by
Thomas Liston J
Bought by
St Pierre Monique
Current Estimated Value
Home Financials for this Owner
Home Financials are based on the most recent Mortgage that was taken out on this home.
Original Mortgage
$147,283
Outstanding Balance
$136,332
Interest Rate
3.45%
Mortgage Type
FHA
Estimated Equity
$88,452
Purchase Details
Closed on
Mar 23, 2009
Sold by
Branch Banking & Trust
Bought by
Thomas Liston J
Purchase Details
Closed on
Oct 7, 2008
Sold by
R & B Construction Inc
Bought by
Branch Banking & Trust Co
Purchase Details
Closed on
Aug 29, 2005
Sold by
Dried Indian Creek Llc
Bought by
Mitchell Bldg Llc
Home Financials for this Owner
Home Financials are based on the most recent Mortgage that was taken out on this home.
Original Mortgage
$999,900
Interest Rate
6.1%
Create a Home Valuation Report for This Property
The Home Valuation Report is an in-depth analysis detailing your home's value as well as a comparison with similar homes in the area
Home Values in the Area
Average Home Value in this Area
Purchase History
| Date | Buyer | Sale Price | Title Company |
|---|---|---|---|
| St Pierre Monique | $150,000 | -- | |
| Thomas Liston J | $45,100 | -- | |
| Branch Banking & Trust Co | $84,600 | -- | |
| Mitchell Bldg Llc | $288,000 | -- |
Source: Public Records
Mortgage History
| Date | Status | Borrower | Loan Amount |
|---|---|---|---|
| Open | St Pierre Monique | $147,283 | |
| Previous Owner | Mitchell Bldg Llc | $999,900 |
Source: Public Records
Tax History Compared to Growth
Tax History
| Year | Tax Paid | Tax Assessment Tax Assessment Total Assessment is a certain percentage of the fair market value that is determined by local assessors to be the total taxable value of land and additions on the property. | Land | Improvement |
|---|---|---|---|---|
| 2024 | $2,947 | $97,600 | $13,600 | $84,000 |
| 2023 | $2,840 | $87,400 | $6,800 | $80,600 |
| 2022 | $2,023 | $62,240 | $6,800 | $55,440 |
| 2021 | $1,778 | $48,960 | $6,800 | $42,160 |
| 2020 | $1,688 | $42,320 | $6,800 | $35,520 |
| 2019 | $1,516 | $37,320 | $6,800 | $30,520 |
| 2018 | $1,461 | $35,560 | $6,000 | $29,560 |
| 2017 | $971 | $23,640 | $4,000 | $19,640 |
| 2016 | $856 | $20,840 | $1,200 | $19,640 |
| 2015 | $836 | $20,320 | $1,200 | $19,120 |
| 2014 | $836 | $20,320 | $0 | $0 |
Source: Public Records
Map
Nearby Homes
- 7776 Sudbury Cir
- 7661 Saffron Ave
- 7651 Saffron Ave
- 7641 Saffron Ave
- 7619 Saffron Ave
- 5160 Avery St SW
- 7662 Saffron Ave
- 7714 Saffron Ave
- 7776 Saffron Ave
- 7636 Saffron Ave
- 7630 Saffron Ave
- 7624 Saffron Ave
- 7620 Saffron Ave
- 6191 Indian Creek Cir SW
- 3107 Hendrix Cir SW
- 3132 Lunsford Cir SW
- 4105 Washington St SW
- Copernicus Plan at Ashford Park
- Radiance Plan at Ashford Park
- Beacon Plan at Ashford Park
- 5171 Tew Ln SW
- 5175 Tew Ln SW
- 0 Tew Ln SW Unit 8802793
- 0 Tew Ln SW Unit 8240744
- 0 Tew Ln SW Unit 8150857
- 5179 Tew Ln SW
- 5100 Lynxs Cir SW
- 5183 Tew Ln SW
- 5183 Tew Ln SW Unit 5183
- 5102 Lynxs Cir SW
- 5104 Lynxs Cir SW
- 5106 Lynxs Cir SW
- 5185 Tew Ln SW
- 5138 Tew Ln SW
- 5187 Tew Ln SW
- 5982 Everett St SW
- 5189 Tew Ln SW
- 5196 Tew Ln SW
- 5117 Lynxs Cir SW
- 5984 Everett St SW