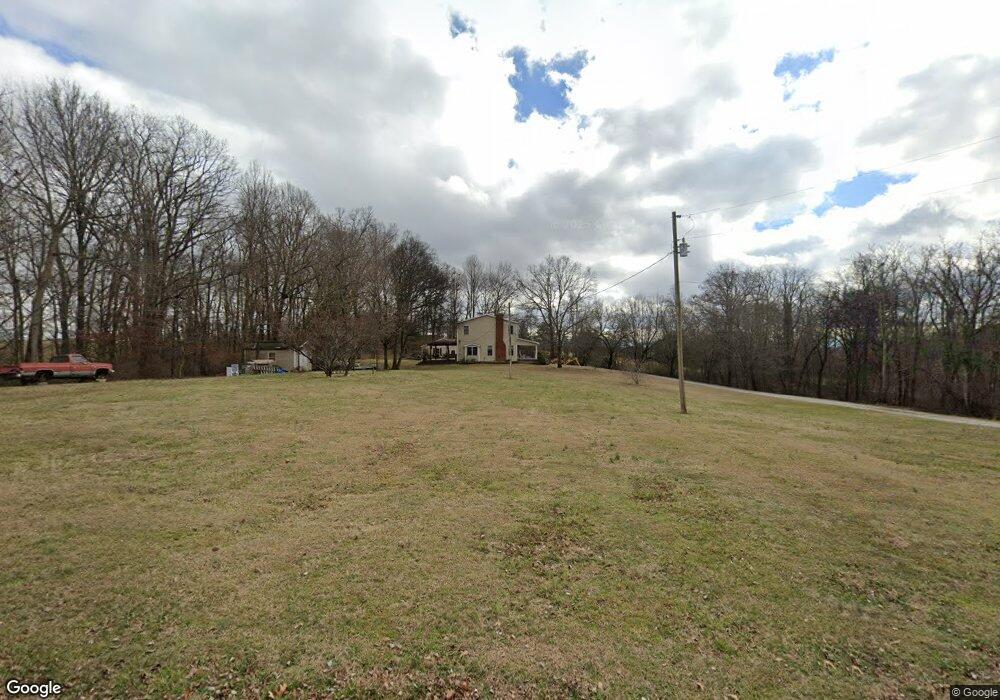
517 Cannon Rd Jefferson City, TN 37760
Estimated Value: $313,000 - $408,165
--
Bed
1
Bath
2,277
Sq Ft
$160/Sq Ft
Est. Value
About This Home
This home is located at 517 Cannon Rd, Jefferson City, TN 37760 and is currently estimated at $364,791, approximately $160 per square foot. 517 Cannon Rd is a home located in Jefferson County.
Ownership History
Date
Name
Owned For
Owner Type
Purchase Details
Closed on
Feb 4, 2005
Bought by
Young Brian and Young Ruth
Current Estimated Value
Purchase Details
Closed on
Apr 20, 2000
Sold by
Bowlin James L and Bowlin Norma
Bought by
Ruth Young
Purchase Details
Closed on
Apr 12, 2000
Bought by
Young Ruth and Young Brian
Purchase Details
Closed on
Apr 13, 1998
Bought by
Bowlin James L and Bowlin Norma
Purchase Details
Closed on
Nov 22, 1994
Bought by
Young Brian and Young Ruth A
Purchase Details
Closed on
Jul 3, 1982
Bought by
Collins Leeper R and Collins Robert E
Create a Home Valuation Report for This Property
The Home Valuation Report is an in-depth analysis detailing your home's value as well as a comparison with similar homes in the area
Home Values in the Area
Average Home Value in this Area
Purchase History
| Date | Buyer | Sale Price | Title Company |
|---|---|---|---|
| Young Brian | -- | -- | |
| Ruth Young | $82,963 | -- | |
| Young Ruth | $83,000 | -- | |
| Bowlin James L | $75,000 | -- | |
| Young Brian | $55,000 | -- | |
| Collins Leeper R | -- | -- |
Source: Public Records
Tax History Compared to Growth
Tax History
| Year | Tax Paid | Tax Assessment Tax Assessment Total Assessment is a certain percentage of the fair market value that is determined by local assessors to be the total taxable value of land and additions on the property. | Land | Improvement |
|---|---|---|---|---|
| 2025 | $1,228 | $80,725 | $21,575 | $59,150 |
| 2023 | $1,228 | $53,375 | $0 | $0 |
| 2022 | $1,169 | $53,375 | $15,600 | $37,775 |
| 2021 | $1,169 | $53,375 | $15,600 | $37,775 |
| 2020 | $1,169 | $53,375 | $15,600 | $37,775 |
| 2019 | $1,169 | $53,375 | $15,600 | $37,775 |
| 2018 | $1,168 | $49,700 | $15,600 | $34,100 |
| 2017 | $1,168 | $49,700 | $15,600 | $34,100 |
| 2016 | $1,168 | $49,700 | $15,600 | $34,100 |
| 2015 | $1,168 | $49,700 | $15,600 | $34,100 |
| 2014 | $1,168 | $49,700 | $15,600 | $34,100 |
Source: Public Records
Map
Nearby Homes