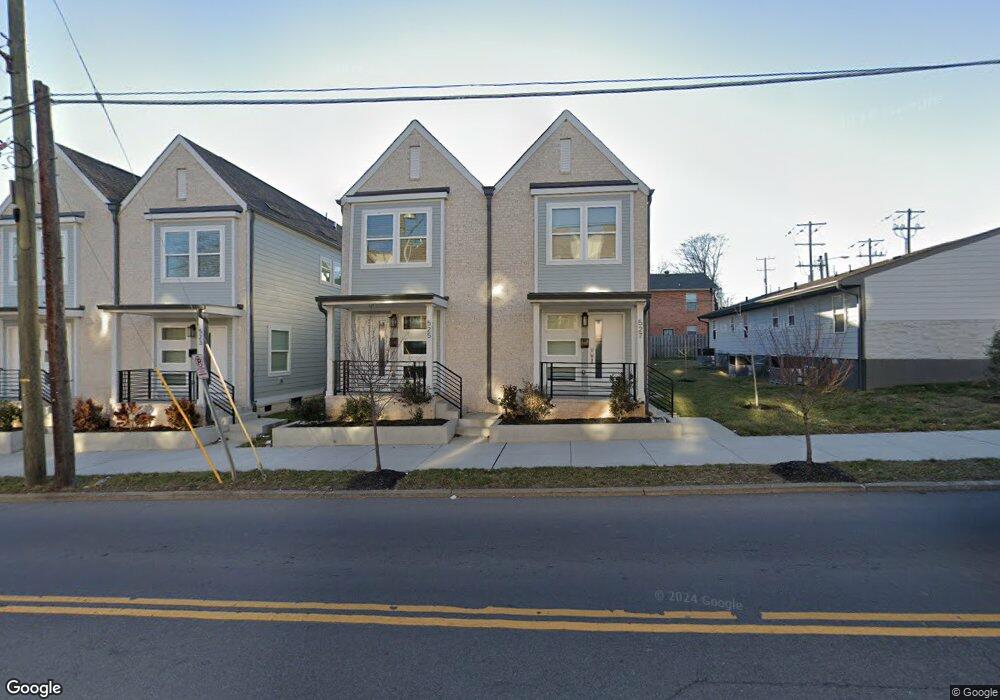
517 Dr Db Todd Jr Blvd Nashville, TN 37203
Germantown NeighborhoodEstimated Value: $1,196,000 - $1,496,000
7
Beds
7
Baths
4,023
Sq Ft
$335/Sq Ft
Est. Value
About This Home
This home is located at 517 Dr Db Todd Jr Blvd, Nashville, TN 37203 and is currently estimated at $1,346,000, approximately $334 per square foot. 517 Dr Db Todd Jr Blvd is a home located in Davidson County with nearby schools including Park Avenue Elementary School, Mckissack Middle School, and Pearl Cohn Magnet High School.
Ownership History
Date
Name
Owned For
Owner Type
Purchase Details
Closed on
Mar 27, 2019
Sold by
Williams Jannie Carter and Carter Lisa
Bought by
Albarati Nagi Hamied and Hauter Nagi
Current Estimated Value
Home Financials for this Owner
Home Financials are based on the most recent Mortgage that was taken out on this home.
Original Mortgage
$960,000
Outstanding Balance
$844,011
Interest Rate
4.3%
Mortgage Type
Commercial
Estimated Equity
$501,989
Purchase Details
Closed on
May 12, 2017
Sold by
Morrison Albert B and Morrison Dorothy L
Bought by
Williams Jannie Carter and Perry Joseph L
Home Financials for this Owner
Home Financials are based on the most recent Mortgage that was taken out on this home.
Original Mortgage
$461,950
Interest Rate
4.14%
Mortgage Type
New Conventional
Purchase Details
Closed on
May 10, 1996
Sold by
Nolan John W
Bought by
Morrison Albert B
Create a Home Valuation Report for This Property
The Home Valuation Report is an in-depth analysis detailing your home's value as well as a comparison with similar homes in the area
Home Values in the Area
Average Home Value in this Area
Purchase History
| Date | Buyer | Sale Price | Title Company |
|---|---|---|---|
| Albarati Nagi Hamied | $875,000 | Rudy Title & Escrow Llc | |
| Williams Jannie Carter | $605,000 | Attorneys Title Co Inc | |
| Morrison Albert B | $70,000 | -- | |
| Morrison Albert B | $70,000 | -- |
Source: Public Records
Mortgage History
| Date | Status | Borrower | Loan Amount |
|---|---|---|---|
| Open | Albarati Nagi Hamied | $960,000 | |
| Previous Owner | Williams Jannie Carter | $461,950 |
Source: Public Records
Tax History Compared to Growth
Tax History
| Year | Tax Paid | Tax Assessment Tax Assessment Total Assessment is a certain percentage of the fair market value that is determined by local assessors to be the total taxable value of land and additions on the property. | Land | Improvement |
|---|---|---|---|---|
| 2024 | $20,210 | $621,080 | $300,000 | $321,080 |
| 2023 | $20,210 | $621,080 | $300,000 | $321,080 |
| 2022 | $20,210 | $621,080 | $300,000 | $321,080 |
| 2021 | $19,725 | $536,360 | $300,000 | $236,360 |
| 2020 | $9,470 | $226,040 | $153,000 | $73,040 |
| 2019 | $7,132 | $226,040 | $153,000 | $73,040 |
| 2018 | $7,132 | $226,040 | $153,000 | $73,040 |
| 2017 | $3,310 | $104,920 | $31,880 | $73,040 |
| 2016 | $3,002 | $66,480 | $3,000 | $63,480 |
| 2015 | $3,002 | $66,480 | $3,000 | $63,480 |
| 2014 | $3,002 | $66,480 | $3,000 | $63,480 |
Source: Public Records
Map
Nearby Homes
- 1816 Jo Johnston Ave
- 510 Fisk St Unit B
- 419 Fisk St
- 1923 Britt Place Unit B
- 1923 Britt Place Unit A
- 903 19th Ave N
- 612 21st Ave N Unit 213
- 2020 Clifton Ave
- 610 21st Ave N Unit 302
- 610 21st Ave N Unit 101
- 1808 State St Unit 307
- 1808 State St Unit 101
- 2002 Herman St Unit D
- 2030 Herman St
- 1717 Hayes St Unit 1609
- 1717 Hayes St Unit 1502
- 1717 Hayes St Unit 1517
- 1717 Hayes St Unit 2004
- 1717 Hayes St Unit 1613
- 1717 Hayes St Unit 2302
- 517 Doctor Db Todd Junior Blvd
- 517 Doctor Db Todd Junior Blvd Unit 521
- 515 Doctor Db Todd Junior Blvd
- 518 Doctor Db Todd Junior Blvd
- 522 Doctor Db Todd Junior Blvd
- 1801C Jo Johnston Ave Unit C
- 1801B Jo Johnston Ave Unit B
- 1801 Jo Johnston Ave Unit C
- 1801 Jo Johnston Ave
- 1801 Jo Johnston Ave Unit A,B,C
- 524 Doctor Db Todd Junior Blvd
- 520 Dr Db Todd Jr Blvd
- 518 Dr Db Todd Jr Blvd
- 515 Dr Db Todd Jr Blvd
- 532 19th Ave N
- 513 Dr Db Todd Jr Blvd
- 524 Dr Db Todd Jr Blvd
- 526 Doctor Db Todd Junior Blvd
- 513 Doctor Db Todd Junior Blvd
- 526 Dr Db Todd Jr Blvd