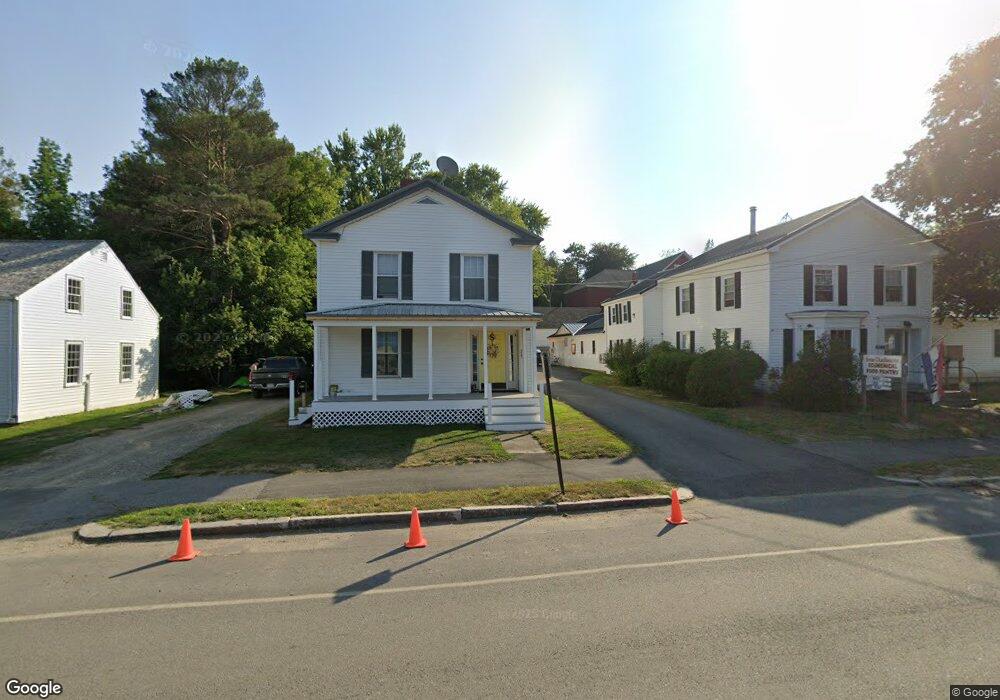
517 Main St Calais, ME 04619
Estimated Value: $141,000 - $249,000
4
Beds
1
Bath
1,035
Sq Ft
$170/Sq Ft
Est. Value
About This Home
This home is located at 517 Main St, Calais, ME 04619 and is currently estimated at $175,961, approximately $170 per square foot. 517 Main St is a home with nearby schools including Calais Elementary School and Calais Middle/High School.
Ownership History
Date
Name
Owned For
Owner Type
Purchase Details
Closed on
Aug 26, 2022
Sold by
Saunders Lawrence S
Bought by
Smith Jayna M
Current Estimated Value
Home Financials for this Owner
Home Financials are based on the most recent Mortgage that was taken out on this home.
Original Mortgage
$65,000
Outstanding Balance
$61,821
Interest Rate
5.54%
Mortgage Type
Purchase Money Mortgage
Estimated Equity
$114,140
Purchase Details
Closed on
Jun 7, 2012
Sold by
Smith Jayna M
Bought by
Smith Jayna M and Saunders Lawrence S
Home Financials for this Owner
Home Financials are based on the most recent Mortgage that was taken out on this home.
Original Mortgage
$68,850
Interest Rate
3.9%
Mortgage Type
Commercial
Purchase Details
Closed on
Apr 5, 2006
Sold by
Pagels Steven F
Bought by
Smith Jayna M
Home Financials for this Owner
Home Financials are based on the most recent Mortgage that was taken out on this home.
Original Mortgage
$50,400
Interest Rate
6.26%
Mortgage Type
Commercial
Create a Home Valuation Report for This Property
The Home Valuation Report is an in-depth analysis detailing your home's value as well as a comparison with similar homes in the area
Home Values in the Area
Average Home Value in this Area
Purchase History
| Date | Buyer | Sale Price | Title Company |
|---|---|---|---|
| Smith Jayna M | -- | Liberty Title | |
| Smith Jayna M | -- | -- | |
| Smith Jayna M | -- | -- |
Source: Public Records
Mortgage History
| Date | Status | Borrower | Loan Amount |
|---|---|---|---|
| Open | Smith Jayna M | $65,000 | |
| Previous Owner | Smith Jayna M | $68,850 | |
| Previous Owner | Smith Jayna M | $50,400 |
Source: Public Records
Tax History
| Year | Tax Paid | Tax Assessment Tax Assessment Total Assessment is a certain percentage of the fair market value that is determined by local assessors to be the total taxable value of land and additions on the property. | Land | Improvement |
|---|---|---|---|---|
| 2024 | $1,296 | $86,400 | $21,100 | $65,300 |
| 2023 | $1,267 | $74,500 | $18,200 | $56,300 |
| 2022 | $1,144 | $60,200 | $14,700 | $45,500 |
| 2021 | $1,248 | $57,800 | $14,100 | $43,700 |
| 2020 | $1,250 | $49,400 | $12,100 | $37,300 |
| 2019 | $1,250 | $49,400 | $12,100 | $37,300 |
| 2018 | $1,250 | $49,400 | $12,100 | $37,300 |
| 2017 | $1,250 | $49,400 | $12,100 | $37,300 |
| 2016 | $1,250 | $49,400 | $12,100 | $37,300 |
| 2015 | $1,250 | $49,400 | $12,100 | $37,300 |
| 2014 | $1,250 | $49,400 | $12,100 | $37,300 |
| 2013 | $1,250 | $49,400 | $12,100 | $37,300 |
Source: Public Records
Map
Nearby Homes
Your Personal Tour Guide
Ask me questions while you tour the home.