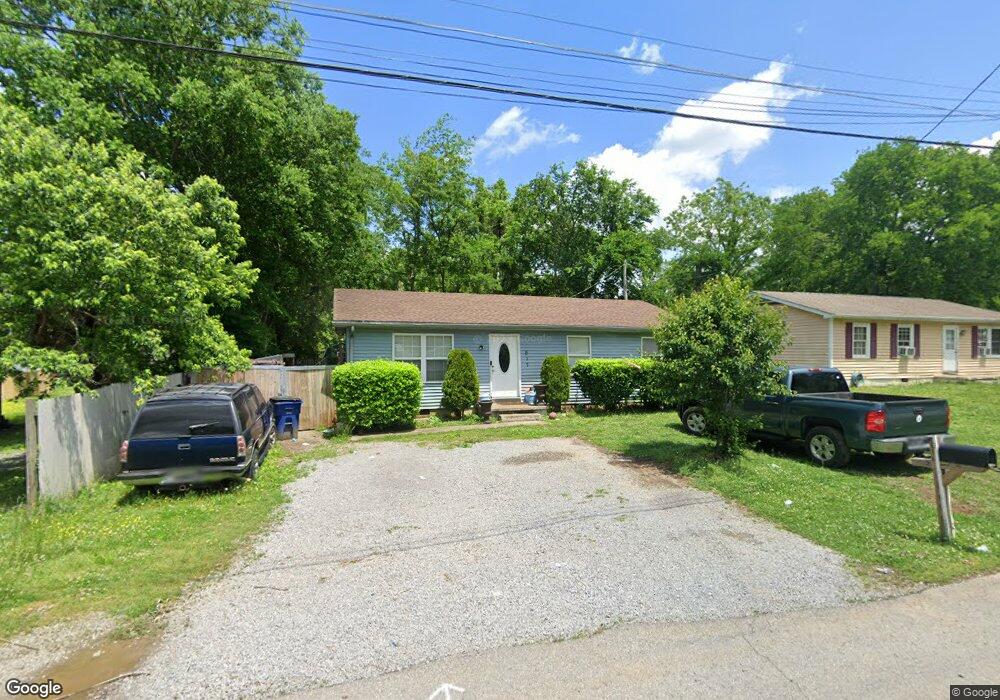
517 Oak St Shelbyville, TN 37160
Estimated Value: $136,000 - $191,000
--
Bed
2
Baths
960
Sq Ft
$175/Sq Ft
Est. Value
About This Home
This home is located at 517 Oak St, Shelbyville, TN 37160 and is currently estimated at $167,667, approximately $174 per square foot. 517 Oak St is a home located in Bedford County with nearby schools including East Side Elementary School, Harris Middle School, and Christian Chapel Academy.
Ownership History
Date
Name
Owned For
Owner Type
Purchase Details
Closed on
Aug 6, 2008
Sold by
Hicks Dorothy J Vincent
Bought by
Beristain Norma
Current Estimated Value
Purchase Details
Closed on
Jun 10, 1996
Sold by
Fralix Earl
Bought by
Jacksondarryl A
Home Financials for this Owner
Home Financials are based on the most recent Mortgage that was taken out on this home.
Original Mortgage
$30,000
Interest Rate
8.21%
Purchase Details
Closed on
Jul 13, 1993
Bought by
Fralix Earl and Ozell Dunnavant
Purchase Details
Closed on
Dec 12, 1991
Bought by
Nichols Earlin R and Nichols Joyce E
Purchase Details
Closed on
Mar 15, 1991
Bought by
Farmers Home Admin
Purchase Details
Closed on
Sep 27, 1988
Bought by
Brown Reginald A
Purchase Details
Closed on
Apr 13, 1988
Bought by
Farmers Home Admin
Purchase Details
Closed on
May 12, 1987
Bought by
Eley Dawn
Purchase Details
Closed on
Dec 5, 1986
Bought by
Keltons Cons Co
Create a Home Valuation Report for This Property
The Home Valuation Report is an in-depth analysis detailing your home's value as well as a comparison with similar homes in the area
Home Values in the Area
Average Home Value in this Area
Purchase History
| Date | Buyer | Sale Price | Title Company |
|---|---|---|---|
| Beristain Norma | $45,000 | -- | |
| Jacksondarryl A | $37,500 | -- | |
| Fralix Earl | $34,900 | -- | |
| Nichols Earlin R | $31,200 | -- | |
| Farmers Home Admin | -- | -- | |
| Brown Reginald A | -- | -- | |
| Farmers Home Admin | -- | -- | |
| Eley Dawn | -- | -- | |
| Keltons Cons Co | -- | -- |
Source: Public Records
Mortgage History
| Date | Status | Borrower | Loan Amount |
|---|---|---|---|
| Previous Owner | Keltons Cons Co | $30,000 |
Source: Public Records
Tax History Compared to Growth
Tax History
| Year | Tax Paid | Tax Assessment Tax Assessment Total Assessment is a certain percentage of the fair market value that is determined by local assessors to be the total taxable value of land and additions on the property. | Land | Improvement |
|---|---|---|---|---|
| 2025 | -- | $19,300 | $0 | $0 |
| 2024 | -- | $19,300 | $4,225 | $15,075 |
| 2023 | $735 | $19,300 | $4,225 | $15,075 |
| 2022 | $756 | $19,300 | $4,225 | $15,075 |
| 2021 | $686 | $19,300 | $4,225 | $15,075 |
| 2020 | $544 | $19,300 | $4,225 | $15,075 |
| 2019 | $544 | $12,275 | $2,250 | $10,025 |
| 2018 | $531 | $12,275 | $2,250 | $10,025 |
| 2017 | $531 | $12,275 | $2,250 | $10,025 |
| 2016 | $527 | $12,275 | $2,250 | $10,025 |
| 2015 | $527 | $12,275 | $2,250 | $10,025 |
| 2014 | $481 | $12,270 | $0 | $0 |
Source: Public Records
Map
Nearby Homes
- 120 Dogwood Ct
- 709 Belmont Ave
- 220 Walnut St
- 222 Carter St
- 102 Germantown Rd
- 0 E Depot St
- 211 S Fairoak St
- 112 Elizabeth St
- 215 Coney Island Rd
- 207 Martha St
- 464 Whitthorne St
- 314 Maplewood Dr
- 627 E Lane St
- 631 E Lane St
- 418 Riverview Dr
- 527 Deery St
- 611 Coble Cir
- 107 Rockwood Dr
- 508 Lewis Ave
- 713 King Ave