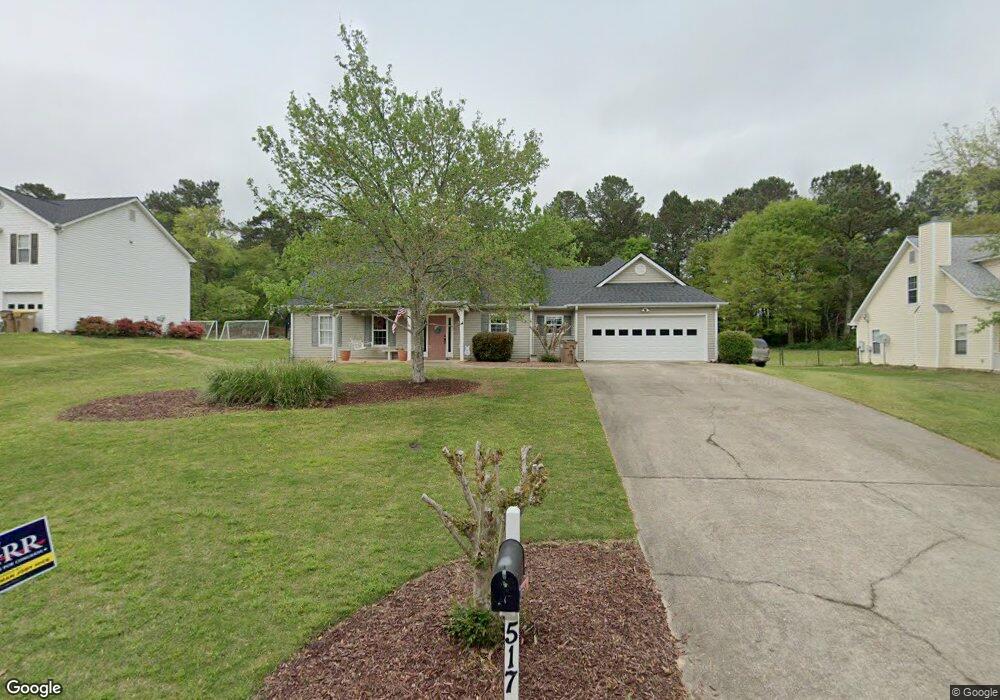
517 Saddle Ridge Dr Unit 1 Bethlehem, GA 30620
Estimated Value: $327,000 - $339,611
3
Beds
2
Baths
1,742
Sq Ft
$192/Sq Ft
Est. Value
About This Home
This home is located at 517 Saddle Ridge Dr Unit 1, Bethlehem, GA 30620 and is currently estimated at $334,903, approximately $192 per square foot. 517 Saddle Ridge Dr Unit 1 is a home located in Barrow County with nearby schools including Yargo Elementary School, Haymon-Morris Middle School, and Apalachee High School.
Ownership History
Date
Name
Owned For
Owner Type
Purchase Details
Closed on
Jun 1, 2009
Sold by
Federal Home Loan Mortgage Corporation
Bought by
Timms J Ryan
Current Estimated Value
Home Financials for this Owner
Home Financials are based on the most recent Mortgage that was taken out on this home.
Original Mortgage
$93,253
Interest Rate
5.27%
Mortgage Type
FHA
Purchase Details
Closed on
Dec 2, 2008
Sold by
Wells Fargo Bank Na
Bought by
Federal Home Loan Mortgage Corporation
Purchase Details
Closed on
Aug 13, 1999
Sold by
Triple R Bldrs Inc
Bought by
Valles Margo D
Home Financials for this Owner
Home Financials are based on the most recent Mortgage that was taken out on this home.
Original Mortgage
$114,059
Interest Rate
7.58%
Mortgage Type
FHA
Purchase Details
Closed on
Feb 4, 1999
Sold by
Belmont Neighborhood
Bought by
Triple R Builders In
Purchase Details
Closed on
Apr 1, 1996
Bought by
Belmont Neighborhood
Create a Home Valuation Report for This Property
The Home Valuation Report is an in-depth analysis detailing your home's value as well as a comparison with similar homes in the area
Home Values in the Area
Average Home Value in this Area
Purchase History
| Date | Buyer | Sale Price | Title Company |
|---|---|---|---|
| Timms J Ryan | -- | -- | |
| Federal Home Loan Mortgage Corporation | -- | -- | |
| Wells Fargo Bank Na | $113,155 | -- | |
| Valles Margo D | $115,000 | -- | |
| Triple R Builders In | $95,600 | -- | |
| Belmont Neighborhood | -- | -- |
Source: Public Records
Mortgage History
| Date | Status | Borrower | Loan Amount |
|---|---|---|---|
| Previous Owner | Timms J Ryan | $93,253 | |
| Previous Owner | Valles Margo D | $114,059 |
Source: Public Records
Tax History Compared to Growth
Tax History
| Year | Tax Paid | Tax Assessment Tax Assessment Total Assessment is a certain percentage of the fair market value that is determined by local assessors to be the total taxable value of land and additions on the property. | Land | Improvement |
|---|---|---|---|---|
| 2024 | $2,815 | $111,909 | $24,000 | $87,909 |
| 2023 | $2,815 | $112,309 | $24,000 | $88,309 |
| 2022 | $2,512 | $85,923 | $16,000 | $69,923 |
| 2021 | $2,267 | $72,888 | $16,000 | $56,888 |
| 2020 | $2,271 | $72,888 | $16,000 | $56,888 |
| 2019 | $2,047 | $64,197 | $16,000 | $48,197 |
| 2018 | $1,952 | $61,797 | $13,600 | $48,197 |
| 2017 | $1,383 | $47,490 | $13,600 | $33,890 |
| 2016 | $1,465 | $46,190 | $13,600 | $32,590 |
| 2015 | $1,483 | $46,564 | $13,600 | $32,964 |
| 2014 | $1,332 | $40,198 | $6,860 | $33,338 |
| 2013 | -- | $37,767 | $6,860 | $30,907 |
Source: Public Records
Map
Nearby Homes
- 1129 Loganville Hwy
- 1111 Otis Dr
- 1024 Lyndhurst Ln
- 1164 Otis Dr
- 209 Angie Way
- 1441 Dillard Heights Dr
- 303 Ron Dr
- 704 Newnham Walk
- 738 Worth Ct
- 724 Westbury Dr
- 720 Westbury Ct
- 934 Beaver Hill Dr
- The Barnes Plan at River Meadows
- The Paisley Plan at River Meadows
- The Rose II Plan at River Meadows
- The Logan Plan at River Meadows
- 73 Silverleaf Trail
- 64 Silverleaf Trail
- 758 Clarence Edwards Rd
- 2018 Ben Johnson Rd
- 517 Saddle Ridge Dr
- 519 Saddle Ridge Dr
- 515 Saddle Ridge Dr
- 513 Saddle Ridge Dr
- 521 Saddle Ridge Dr
- 508 Saddle Ridge Dr Unit 55
- 508 Saddle Ridge Dr
- 523 Saddle Ridge Dr
- 523 Saddle Ridge Dr Unit 1
- 629 Bridle Creek Dr Unit 1
- 629 Bridle Creek Dr
- 1132 Otis Dr
- 506 Saddle Ridge Dr
- 511 Saddle Ridge Dr
- 1134 Otis Dr
- 1130 Otis Dr
- 509 Saddle Ridge Dr
- 627 Bridle Creek Dr
- 1128 Otis Dr
- 525 Saddle Ridge Dr