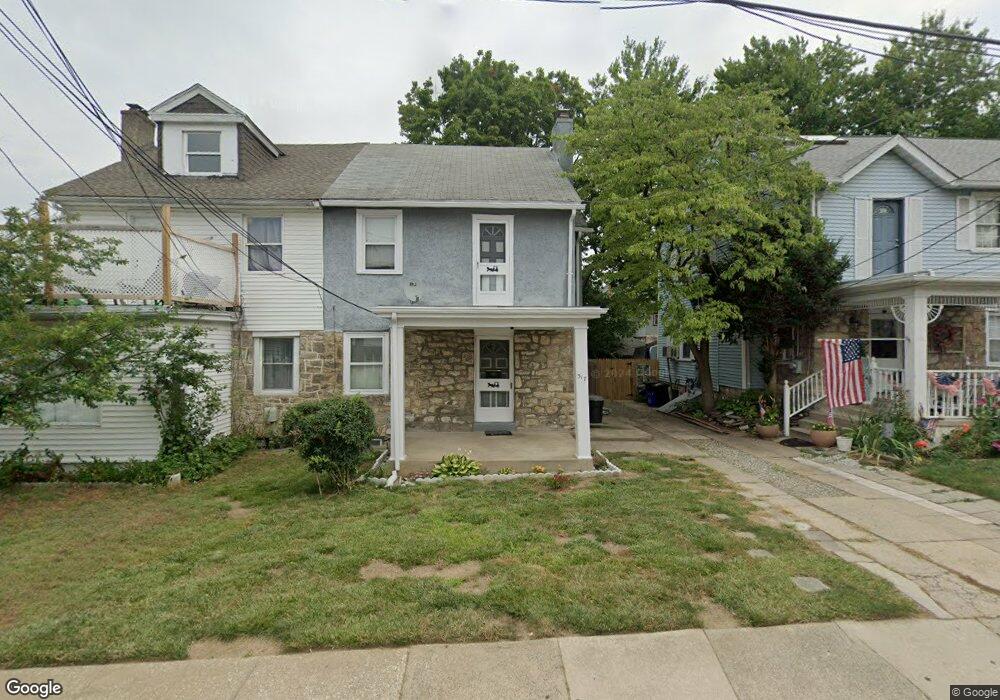
517 Sansom St Upper Darby, PA 19082
Estimated Value: $227,703 - $294,000
3
Beds
1
Bath
1,681
Sq Ft
$161/Sq Ft
Est. Value
About This Home
This home is located at 517 Sansom St, Upper Darby, PA 19082 and is currently estimated at $270,426, approximately $160 per square foot. 517 Sansom St is a home located in Delaware County with nearby schools including Upper Darby Kdg Center, Drexel Hill Middle School, and Upper Darby High School.
Ownership History
Date
Name
Owned For
Owner Type
Purchase Details
Closed on
Aug 28, 2000
Sold by
Simotas Ruthann M and Taylor Donald W
Bought by
Paul Daniel and Paul Frances
Current Estimated Value
Home Financials for this Owner
Home Financials are based on the most recent Mortgage that was taken out on this home.
Original Mortgage
$74,200
Outstanding Balance
$27,043
Interest Rate
8.1%
Mortgage Type
FHA
Estimated Equity
$243,383
Create a Home Valuation Report for This Property
The Home Valuation Report is an in-depth analysis detailing your home's value as well as a comparison with similar homes in the area
Home Values in the Area
Average Home Value in this Area
Purchase History
| Date | Buyer | Sale Price | Title Company |
|---|---|---|---|
| Paul Daniel | $74,900 | -- |
Source: Public Records
Mortgage History
| Date | Status | Borrower | Loan Amount |
|---|---|---|---|
| Open | Paul Daniel | $74,200 |
Source: Public Records
Tax History
| Year | Tax Paid | Tax Assessment Tax Assessment Total Assessment is a certain percentage of the fair market value that is determined by local assessors to be the total taxable value of land and additions on the property. | Land | Improvement |
|---|---|---|---|---|
| 2025 | $4,565 | $107,950 | $23,940 | $84,010 |
| 2024 | $4,565 | $107,950 | $23,940 | $84,010 |
| 2023 | $4,522 | $107,950 | $23,940 | $84,010 |
| 2022 | $4,401 | $107,950 | $23,940 | $84,010 |
| 2021 | $5,934 | $107,950 | $23,940 | $84,010 |
| 2020 | $4,624 | $71,480 | $20,160 | $51,320 |
| 2019 | $4,543 | $71,480 | $20,160 | $51,320 |
| 2018 | $4,490 | $71,480 | $0 | $0 |
| 2017 | $4,374 | $71,480 | $0 | $0 |
| 2016 | $392 | $71,480 | $0 | $0 |
| 2015 | $400 | $71,480 | $0 | $0 |
| 2014 | $392 | $71,480 | $0 | $0 |
Source: Public Records
Map
Nearby Homes
- 107 S Keystone Ave
- 129 S Keystone Ave
- 537 Elm Ave
- 512 Fairfield Ave
- 207 Berbro Ave
- 77 N Keystone Ave
- 7425 Rogers Ave
- 35 N State Rd
- 7281 Walnut St
- 38 Copley Rd
- 7603 W Chester Pike
- 15 Kenmore Rd
- 7124 Pennsylvania Ave
- 212 Huntley Rd
- 232 Long Ln
- 274 Avon Rd
- 234 Long Ln
- 207 Avon Rd
- 100 Englewood Rd
- 138 Richfield Rd
Your Personal Tour Guide
Ask me questions while you tour the home.