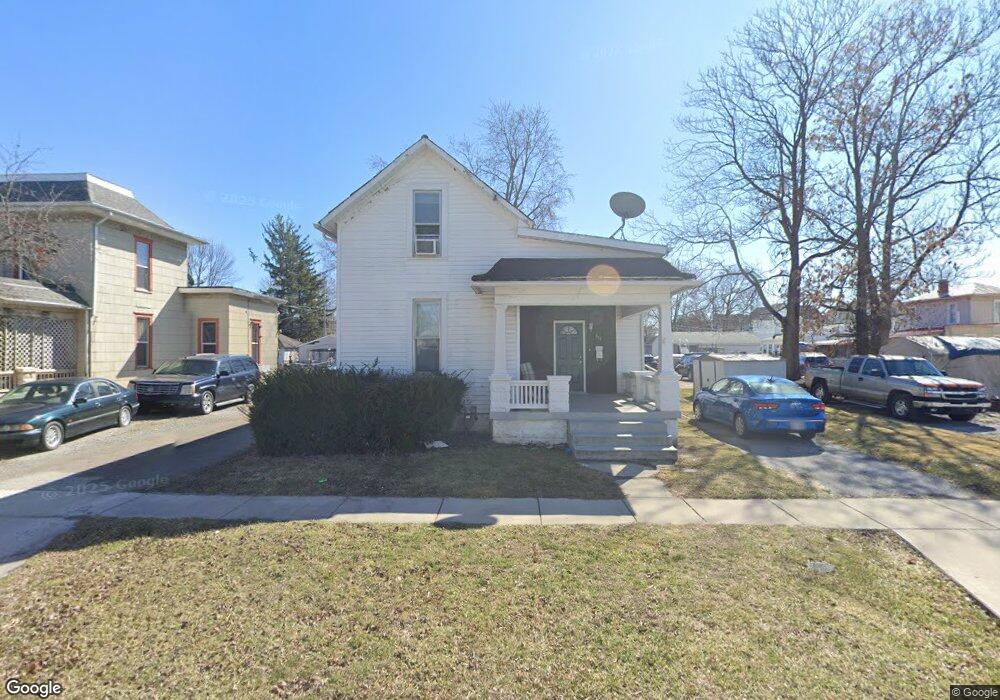
517 South St Findlay, OH 45840
Estimated Value: $90,000 - $153,000
1
Bed
1
Bath
984
Sq Ft
$123/Sq Ft
Est. Value
About This Home
This home is located at 517 South St, Findlay, OH 45840 and is currently estimated at $120,856, approximately $122 per square foot. 517 South St is a home located in Hancock County with nearby schools including Whittier Elementary School, Wilson Vance Elementary School, and Donnell Middle School.
Ownership History
Date
Name
Owned For
Owner Type
Purchase Details
Closed on
Aug 2, 2013
Sold by
Fannie Mae
Bought by
Home Living Rentals Llc
Current Estimated Value
Purchase Details
Closed on
May 8, 2013
Sold by
Slough Christine L
Bought by
Federal National Mortgage Association
Purchase Details
Closed on
Jul 31, 2006
Sold by
Slough Mark J and Slough Cassie S
Bought by
Slough Christine L
Home Financials for this Owner
Home Financials are based on the most recent Mortgage that was taken out on this home.
Original Mortgage
$62,000
Interest Rate
6.82%
Mortgage Type
Purchase Money Mortgage
Purchase Details
Closed on
Nov 16, 1995
Sold by
Williamson Alfred
Bought by
Slough Mark
Purchase Details
Closed on
Sep 18, 1990
Bought by
Williamson Alfred
Purchase Details
Closed on
Jul 8, 1985
Bought by
Sausser Maver J
Create a Home Valuation Report for This Property
The Home Valuation Report is an in-depth analysis detailing your home's value as well as a comparison with similar homes in the area
Home Values in the Area
Average Home Value in this Area
Purchase History
| Date | Buyer | Sale Price | Title Company |
|---|---|---|---|
| Home Living Rentals Llc | $24,500 | Assured Title Agency Inc | |
| Federal National Mortgage Association | $35,733 | None Available | |
| Slough Christine L | $62,000 | Assured Title | |
| Slough Mark | $29,000 | -- | |
| Williamson Alfred | $29,000 | -- | |
| Sausser Maver J | $27,900 | -- |
Source: Public Records
Mortgage History
| Date | Status | Borrower | Loan Amount |
|---|---|---|---|
| Previous Owner | Slough Christine L | $62,000 |
Source: Public Records
Tax History Compared to Growth
Tax History
| Year | Tax Paid | Tax Assessment Tax Assessment Total Assessment is a certain percentage of the fair market value that is determined by local assessors to be the total taxable value of land and additions on the property. | Land | Improvement |
|---|---|---|---|---|
| 2024 | $870 | $23,860 | $2,630 | $21,230 |
| 2023 | $871 | $23,860 | $2,630 | $21,230 |
| 2022 | $868 | $23,860 | $2,630 | $21,230 |
| 2021 | $698 | $16,720 | $2,640 | $14,080 |
| 2020 | $698 | $16,720 | $2,640 | $14,080 |
| 2019 | $685 | $16,720 | $2,640 | $14,080 |
| 2018 | $592 | $13,230 | $2,400 | $10,830 |
| 2017 | $591 | $13,230 | $2,400 | $10,830 |
| 2016 | $596 | $13,230 | $2,400 | $10,830 |
| 2015 | $609 | $13,530 | $2,400 | $11,130 |
| 2014 | $609 | $13,530 | $2,400 | $11,130 |
| 2012 | $554 | $12,500 | $1,590 | $10,910 |
Source: Public Records
Map
Nearby Homes
- 817 Park St
- 820 Selby St
- 904 Morse St
- 210 Eastowne Park Row
- 545 Clinton Ct
- 829 Maple Ave
- 15591 Canadian Way
- 15586 Canadian Way
- 15615 Canadian Way
- 420 1st St
- 523 Center St
- 202 Hancock St
- 1001 Decker Ave
- 1109 Park St
- 309 Huron Rd
- 619 Fishlock Ave
- 1109 Brookside Dr
- 225 Lima Ave
- 720 S West St
- 213 Cherry St
- 607 S Blanchard St
- 601 S Blanchard St
- 519 South St
- 514 South St
- 611 S Blanchard St
- 525 South St
- 516 South St
- 615 S Blanchard St
- 519 S Blanchard St
- 519 S Blanchard St
- 518 South St
- 527 South St
- 528 South St
- 608 Wilson St
- 617 S Blanchard St
- 616 Wilson St
- 621 S Blanchard St
- 601 South St
- 610 S Blanchard St Unit lower
- 610 S Blanchard St