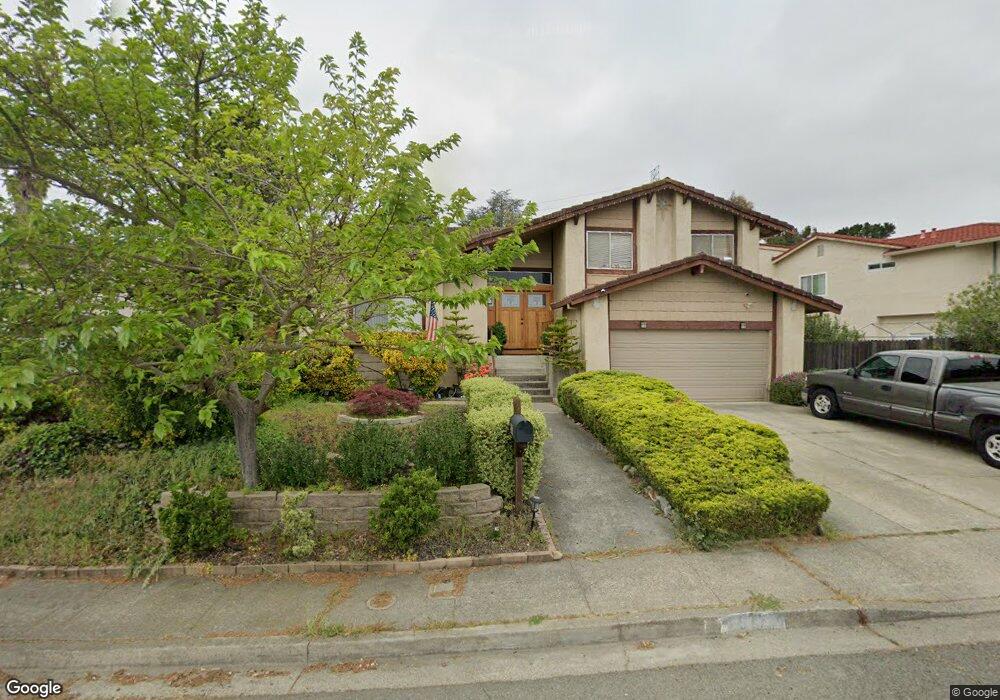
517 Temple Way Vallejo, CA 94591
Estimated Value: $634,199 - $676,000
4
Beds
2
Baths
2,159
Sq Ft
$305/Sq Ft
Est. Value
About This Home
This home is located at 517 Temple Way, Vallejo, CA 94591 and is currently estimated at $659,050, approximately $305 per square foot. 517 Temple Way is a home located in Solano County with nearby schools including Joseph H. Wardlaw Elementary School, Hogan Middle School, and Jesse M. Bethel High School.
Ownership History
Date
Name
Owned For
Owner Type
Purchase Details
Closed on
Jul 10, 2003
Sold by
Kozlik Theodore H
Bought by
Schulmeyer Scott and Schulmeyer Denise
Current Estimated Value
Home Financials for this Owner
Home Financials are based on the most recent Mortgage that was taken out on this home.
Original Mortgage
$308,000
Outstanding Balance
$113,565
Interest Rate
3.5%
Mortgage Type
Purchase Money Mortgage
Estimated Equity
$545,485
Purchase Details
Closed on
May 13, 2002
Sold by
Kozlik Corinne S
Bought by
Kozlik Theodore H
Home Financials for this Owner
Home Financials are based on the most recent Mortgage that was taken out on this home.
Original Mortgage
$182,000
Interest Rate
6.89%
Mortgage Type
Balloon
Purchase Details
Closed on
Jan 26, 2001
Sold by
Kozlik Theodore H and Kozlik R M
Bought by
Kozlik Theodore H
Create a Home Valuation Report for This Property
The Home Valuation Report is an in-depth analysis detailing your home's value as well as a comparison with similar homes in the area
Purchase History
| Date | Buyer | Sale Price | Title Company |
|---|---|---|---|
| Schulmeyer Scott | $385,000 | Chicago Title Co | |
| Kozlik Theodore H | -- | Fidelity National Title Co | |
| Kozlik Theodore H | -- | -- |
Source: Public Records
Mortgage History
| Date | Status | Borrower | Loan Amount |
|---|---|---|---|
| Open | Schulmeyer Scott | $308,000 | |
| Previous Owner | Kozlik Theodore H | $182,000 |
Source: Public Records
Tax History
| Year | Tax Paid | Tax Assessment Tax Assessment Total Assessment is a certain percentage of the fair market value that is determined by local assessors to be the total taxable value of land and additions on the property. | Land | Improvement |
|---|---|---|---|---|
| 2025 | $7,719 | $547,382 | $120,846 | $426,536 |
| 2024 | $7,719 | $536,650 | $118,477 | $418,173 |
| 2023 | $7,359 | $526,128 | $116,154 | $409,974 |
| 2022 | $7,662 | $515,813 | $113,878 | $401,935 |
| 2021 | $7,024 | $505,700 | $111,646 | $394,054 |
| 2020 | $7,075 | $500,516 | $110,502 | $390,014 |
| 2019 | $7,086 | $490,703 | $108,336 | $382,367 |
| 2018 | $6,488 | $481,082 | $106,212 | $374,870 |
| 2017 | $6,461 | $466,000 | $79,000 | $387,000 |
| 2016 | $5,955 | $458,000 | $82,000 | $376,000 |
| 2015 | $4,738 | $387,000 | $70,000 | $317,000 |
| 2014 | $4,340 | $338,000 | $64,000 | $274,000 |
Source: Public Records
Map
Nearby Homes
- 118 Lytham Way
- 124 Gregory Ln
- 155 White Pine Dr
- 1290 Rachel Way
- N/A N A
- 453 Knights Cir
- 401 Avian Dr
- 223 Wedgewood Ct
- 136 Evergreen Way
- 41 Canterbury Cir
- 102 Avian Dr
- 841 Knights Cir
- 103 Sandalwood Ct
- 367 Darley Dr
- 272 Woodridge Dr
- 2500 Springs Rd Unit 121
- 2500 Springs Rd Unit 116
- 22 Brighton Dr
- 6067 Loire Ct
- 121 Jackson Way
Your Personal Tour Guide
Ask me questions while you tour the home.