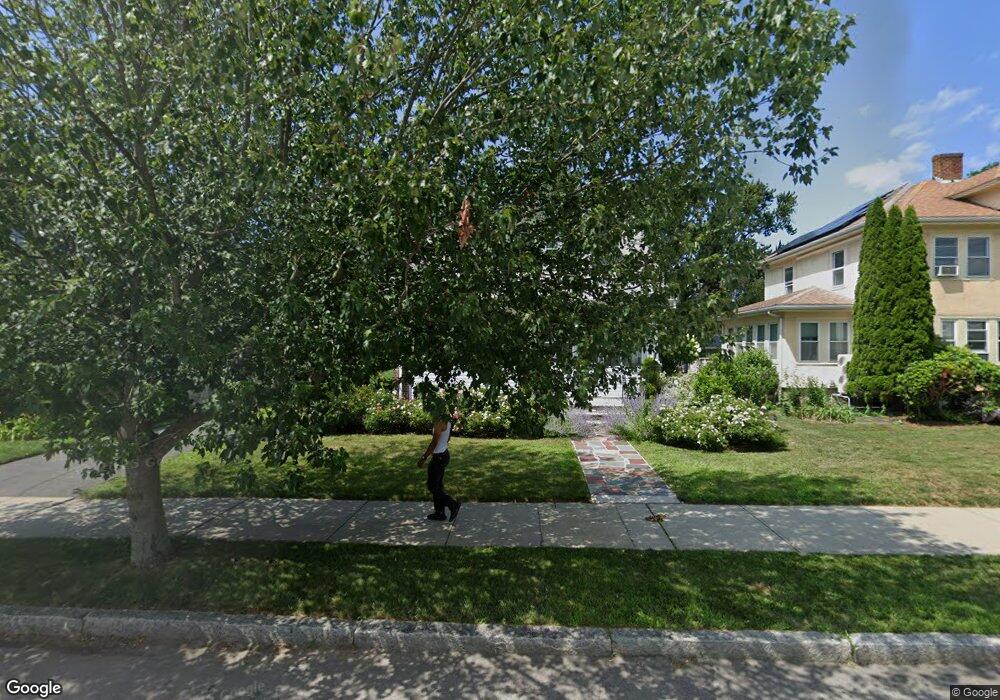
517 W Elm St Brockton, MA 02301
Estimated Value: $506,000 - $547,000
3
Beds
1
Bath
1,400
Sq Ft
$376/Sq Ft
Est. Value
About This Home
This home is located at 517 W Elm St, Brockton, MA 02301 and is currently estimated at $526,030, approximately $375 per square foot. 517 W Elm St is a home located in Plymouth County with nearby schools including Manthala George Jr. School, Hancock Elementary School, and Louis F Angelo Elementary School.
Ownership History
Date
Name
Owned For
Owner Type
Purchase Details
Closed on
Sep 10, 2012
Sold by
Martin Franklin D and Martin Nancy C
Bought by
Martin Nancy C
Current Estimated Value
Purchase Details
Closed on
Jul 30, 2004
Sold by
Martin Nancy C
Bought by
Martin Nancy C and Martin Franklin D
Purchase Details
Closed on
Oct 30, 1998
Sold by
Gabriel Mary L
Bought by
Martin Franklin D and Martin Nancy C
Home Financials for this Owner
Home Financials are based on the most recent Mortgage that was taken out on this home.
Original Mortgage
$118,320
Interest Rate
6.68%
Mortgage Type
Purchase Money Mortgage
Create a Home Valuation Report for This Property
The Home Valuation Report is an in-depth analysis detailing your home's value as well as a comparison with similar homes in the area
Home Values in the Area
Average Home Value in this Area
Purchase History
| Date | Buyer | Sale Price | Title Company |
|---|---|---|---|
| Martin Nancy C | -- | -- | |
| Martin Nancy C | -- | -- | |
| Martin Franklin D | $116,000 | -- |
Source: Public Records
Mortgage History
| Date | Status | Borrower | Loan Amount |
|---|---|---|---|
| Previous Owner | Martin Franklin D | $72,000 | |
| Previous Owner | Martin Franklin D | $36,000 | |
| Previous Owner | Martin Franklin D | $25,000 | |
| Previous Owner | Martin Franklin D | $118,320 |
Source: Public Records
Tax History Compared to Growth
Tax History
| Year | Tax Paid | Tax Assessment Tax Assessment Total Assessment is a certain percentage of the fair market value that is determined by local assessors to be the total taxable value of land and additions on the property. | Land | Improvement |
|---|---|---|---|---|
| 2025 | $5,000 | $412,900 | $144,900 | $268,000 |
| 2024 | $4,800 | $399,300 | $144,900 | $254,400 |
| 2023 | $4,875 | $375,600 | $109,900 | $265,700 |
| 2022 | $4,570 | $327,100 | $99,900 | $227,200 |
| 2021 | $5,065 | $294,800 | $94,700 | $200,100 |
| 2020 | $5,197 | $292,600 | $90,700 | $201,900 |
| 2019 | $4,194 | $269,900 | $85,100 | $184,800 |
| 2018 | $3,713 | $231,200 | $85,100 | $146,100 |
| 2017 | $3,497 | $217,200 | $85,100 | $132,100 |
| 2016 | $3,741 | $215,500 | $81,100 | $134,400 |
| 2015 | $3,458 | $190,500 | $81,100 | $109,400 |
| 2014 | $3,350 | $184,800 | $81,100 | $103,700 |
Source: Public Records
Map
Nearby Homes
- 48 N Belcher Ave
- 72 W Elm Terrace
- 161 Moraine St
- 137 Boylston St
- 15 Byron Ave
- 67 Sycamore Ave Unit 3
- 175 Belmont Ave
- 28 Fern Ave
- 265 Boylston St
- 25 Monson St
- 17 Moraine Place
- 37 West St
- 45 Briarcliff Rd
- 282 Belmont St
- 60 Elm Ave
- 190 Highland St
- 50 Manomet St
- 281 Spring St
- 227 W Elm St Unit 3
- 124 Manomet St