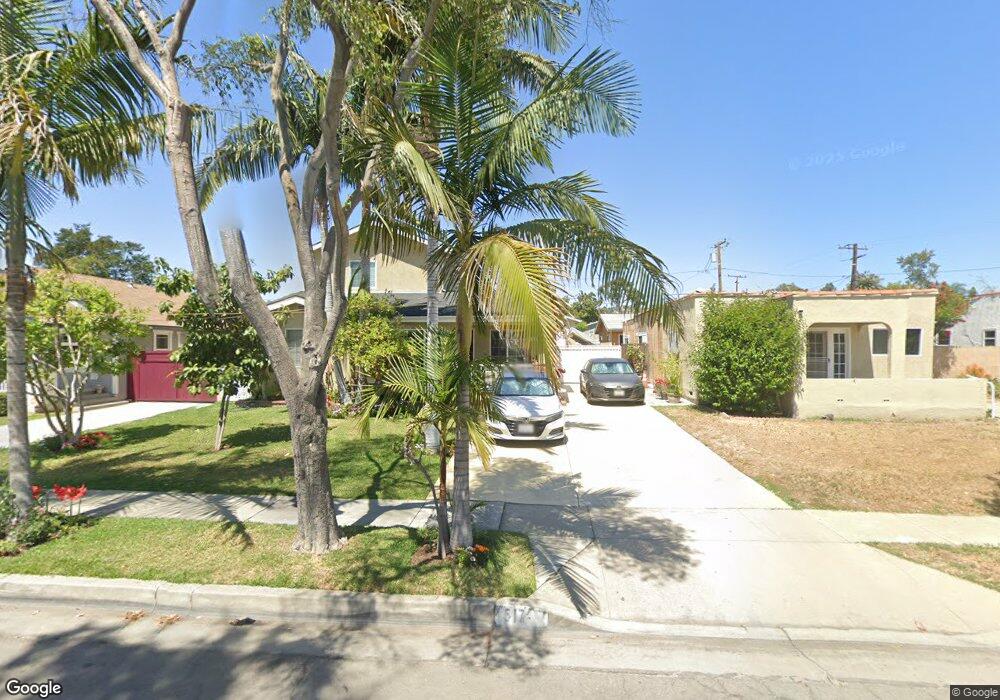
517 W Florence Ave La Habra, CA 90631
Estimated Value: $887,000 - $1,061,000
2
Beds
3
Baths
2,232
Sq Ft
$434/Sq Ft
Est. Value
About This Home
This home is located at 517 W Florence Ave, La Habra, CA 90631 and is currently estimated at $969,676, approximately $434 per square foot. 517 W Florence Ave is a home located in Orange County with nearby schools including Walnut Elementary School, Washington Middle School, and La Habra High School.
Ownership History
Date
Name
Owned For
Owner Type
Purchase Details
Closed on
Feb 7, 2021
Sold by
Alatorre Armando and Alatorre Maria
Bought by
Alatorre Armando and Alatorre Maria
Current Estimated Value
Purchase Details
Closed on
Nov 14, 2012
Sold by
Alatorre Armando
Bought by
Alatorre Armando and Alatorre Maria
Home Financials for this Owner
Home Financials are based on the most recent Mortgage that was taken out on this home.
Original Mortgage
$140,000
Outstanding Balance
$24,780
Interest Rate
3.33%
Mortgage Type
New Conventional
Estimated Equity
$944,896
Purchase Details
Closed on
Feb 8, 2000
Sold by
Armando Alatorre and Cruz Carrillo Cruz
Bought by
Alatorre Armando
Purchase Details
Closed on
Mar 26, 1999
Sold by
Leslie Lopez and Leslie Gloria
Bought by
Alatorre Armando and Carrillo Cruz
Home Financials for this Owner
Home Financials are based on the most recent Mortgage that was taken out on this home.
Original Mortgage
$138,076
Interest Rate
6.92%
Mortgage Type
FHA
Create a Home Valuation Report for This Property
The Home Valuation Report is an in-depth analysis detailing your home's value as well as a comparison with similar homes in the area
Home Values in the Area
Average Home Value in this Area
Purchase History
| Date | Buyer | Sale Price | Title Company |
|---|---|---|---|
| Alatorre Armando | -- | Wfg Title | |
| Alatorre Armando | -- | American Coast Title Company | |
| Alatorre Armando | -- | Chicago Title Co | |
| Alatorre Armando | $139,000 | First American Title Ins Co |
Source: Public Records
Mortgage History
| Date | Status | Borrower | Loan Amount |
|---|---|---|---|
| Open | Alatorre Armando | $140,000 | |
| Previous Owner | Alatorre Armando | $138,076 |
Source: Public Records
Tax History Compared to Growth
Tax History
| Year | Tax Paid | Tax Assessment Tax Assessment Total Assessment is a certain percentage of the fair market value that is determined by local assessors to be the total taxable value of land and additions on the property. | Land | Improvement |
|---|---|---|---|---|
| 2025 | $3,963 | $342,375 | $183,349 | $159,026 |
| 2024 | $3,963 | $335,662 | $179,754 | $155,908 |
| 2023 | $3,869 | $329,081 | $176,230 | $152,851 |
| 2022 | $3,825 | $322,629 | $172,775 | $149,854 |
| 2021 | $3,839 | $316,303 | $169,387 | $146,916 |
| 2020 | $3,803 | $313,060 | $167,650 | $145,410 |
| 2019 | $3,701 | $306,922 | $164,363 | $142,559 |
| 2018 | $3,639 | $300,904 | $161,140 | $139,764 |
| 2017 | $3,575 | $295,004 | $157,980 | $137,024 |
| 2016 | $3,224 | $264,651 | $154,882 | $109,769 |
| 2015 | $3,141 | $261,381 | $152,556 | $108,825 |
| 2014 | $2,846 | $237,097 | $149,568 | $87,529 |
Source: Public Records
Map
Nearby Homes
- 581 W Greenwood Ave Unit 6
- 501 Willow St
- 313 W 1st Ave Unit M
- 720 W La Habra Blvd
- 421 N Marian St
- 950 N Walnut St
- 237 S Monte Vista St
- 320 -330 Monte Vista
- 760 N Orange St
- 762 N Orange St
- 764 N Orange St
- 766 N Orange St
- 770 N Orange St
- Plan 4 - The Sage at The Birchwoods
- Plan 2 - The Poppy at The Birchwoods
- 303 S Cadiz Ct
- 414 W Olive Ave
- 418 W Olive Ave
- 1100 N Euclid St
- 405 W Mountain View Ave
- 515 W Florence Ave
- 519 W Florence Ave
- 513 W Florence Ave
- 521 W Florence Ave
- 522 Highlander Ave
- 518 Highlander Ave
- 526 Highlander Ave
- 514 Highlander Ave
- 530 Highlander Ave
- 520 W Florence Ave
- 525 W Florence Ave
- 516 W Florence Ave
- 524 W Florence Ave
- 534 Highlander Ave
- 407 N Walnut St
- 411 N Walnut St
- 514 W Florence Ave
- 528 W Florence Ave
- 538 Highlander Ave
- 529 W Florence Ave