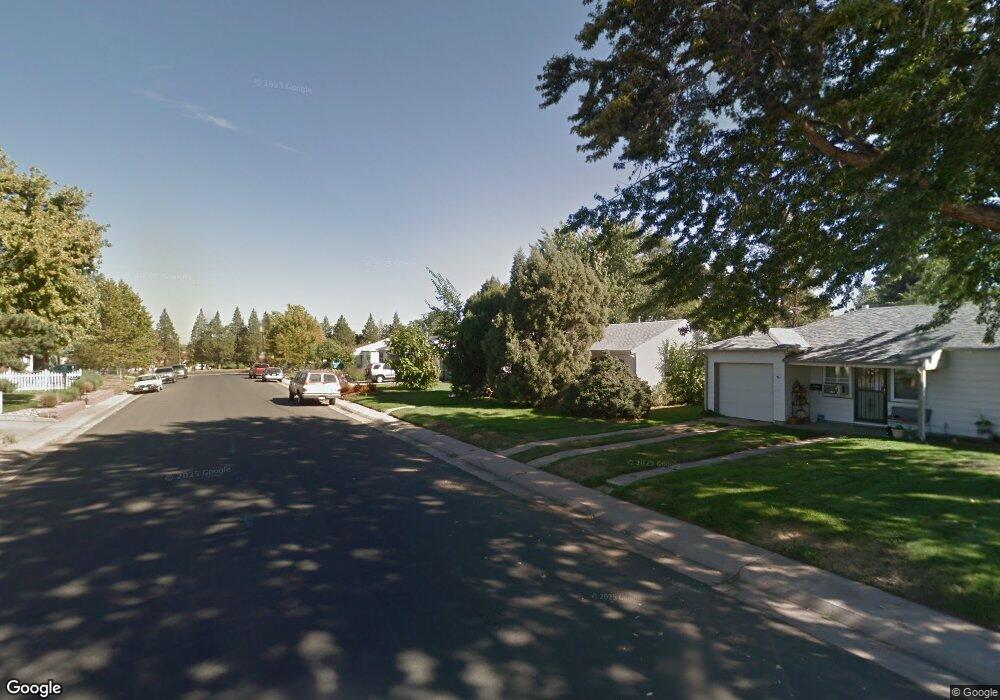
5170 Eliot St Denver, CO 80221
Chaffee Park NeighborhoodEstimated Value: $332,000 - $437,000
2
Beds
1
Bath
896
Sq Ft
$443/Sq Ft
Est. Value
About This Home
This home is located at 5170 Eliot St, Denver, CO 80221 and is currently estimated at $397,000, approximately $443 per square foot. 5170 Eliot St is a home located in Denver County with nearby schools including Beach Court Elementary School, Bryant Webster Dual Language School, and Skinner Middle School.
Ownership History
Date
Name
Owned For
Owner Type
Purchase Details
Closed on
Mar 27, 2024
Sold by
Fulton Desmond G
Bought by
Fulton Desmond G and Fulton Brianna E
Current Estimated Value
Home Financials for this Owner
Home Financials are based on the most recent Mortgage that was taken out on this home.
Original Mortgage
$225,000
Outstanding Balance
$208,071
Interest Rate
6.12%
Mortgage Type
New Conventional
Estimated Equity
$188,929
Purchase Details
Closed on
Mar 19, 2020
Sold by
Sandoval Richard and Fulton Desmond G
Bought by
Fulton Desmond
Home Financials for this Owner
Home Financials are based on the most recent Mortgage that was taken out on this home.
Original Mortgage
$120,000
Interest Rate
3.4%
Mortgage Type
New Conventional
Purchase Details
Closed on
Jun 16, 2004
Sold by
Sandoval Richard
Bought by
Fulton Desmont G and Sandoval Richard
Create a Home Valuation Report for This Property
The Home Valuation Report is an in-depth analysis detailing your home's value as well as a comparison with similar homes in the area
Home Values in the Area
Average Home Value in this Area
Purchase History
| Date | Buyer | Sale Price | Title Company |
|---|---|---|---|
| Fulton Desmond G | -- | None Listed On Document | |
| Fulton Desmond G | -- | None Listed On Document | |
| Fulton Desmond | -- | Land Title Guarantee Co | |
| Fulton Desmont G | -- | -- |
Source: Public Records
Mortgage History
| Date | Status | Borrower | Loan Amount |
|---|---|---|---|
| Open | Fulton Desmond G | $225,000 | |
| Closed | Fulton Desmond G | $225,000 | |
| Previous Owner | Fulton Desmond | $120,000 |
Source: Public Records
Tax History
| Year | Tax Paid | Tax Assessment Tax Assessment Total Assessment is a certain percentage of the fair market value that is determined by local assessors to be the total taxable value of land and additions on the property. | Land | Improvement |
|---|---|---|---|---|
| 2025 | $2,029 | $30,290 | $17,620 | $17,620 |
| 2024 | $2,029 | $25,620 | $13,060 | $12,560 |
| 2023 | $1,985 | $25,620 | $13,060 | $12,560 |
| 2022 | $1,672 | $21,020 | $13,020 | $8,000 |
| 2021 | $1,614 | $21,630 | $13,400 | $8,230 |
| 2020 | $949 | $19,940 | $13,400 | $6,540 |
| 2019 | $922 | $19,940 | $13,400 | $6,540 |
| 2018 | $627 | $15,300 | $6,750 | $8,550 |
| 2017 | $625 | $15,300 | $6,750 | $8,550 |
| 2016 | $510 | $12,490 | $2,985 | $9,505 |
| 2015 | $488 | $12,490 | $2,985 | $9,505 |
| 2014 | $437 | $10,530 | $3,041 | $7,489 |
Source: Public Records
Map
Nearby Homes
- 5167 Eliot St
- 2876 W 53rd Ave Unit 115
- 2876 W 53rd Ave Unit 107
- 2835 W Parkside Place Unit 305
- 2840 W 53rd Ave
- 3017 W 53rd Ave
- 4985 Green Ct
- 3246 W 53rd Ave
- 2940 W 54th Ave
- 4990 Hooker St
- 3011 W 49th Ave
- 2541 W 52nd Ave
- 4876 Decatur St
- 4901 Bryant St
- 4927 Beach Ct
- 2872 W 55th Ave Unit 23
- 5051 Zuni St
- 4870 Irving St
- 2543 W 54th Ave
- 5512 Clay St
Your Personal Tour Guide
Ask me questions while you tour the home.