Estimated Value: $414,000 - $516,000
3
Beds
3
Baths
2,326
Sq Ft
$203/Sq Ft
Est. Value
About This Home
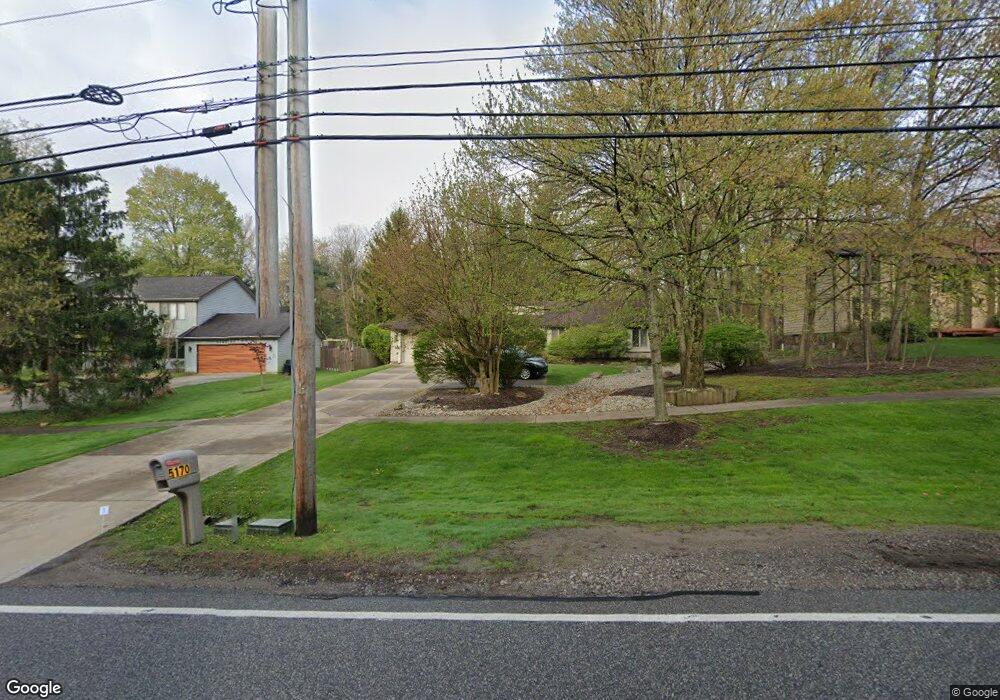
This home is located at 5170 Som Center Rd, Solon, OH 44139 and is currently estimated at $471,036, approximately $202 per square foot. 5170 Som Center Rd is a home located in Cuyahoga County with nearby schools including Dorothy E Lewis Elementary School, Orchard Middle School, and Solon Middle School.
Ownership History
Date
Name
Owned For
Owner Type
Purchase Details
Closed on
Mar 16, 2004
Sold by
Black Cynthia K
Bought by
Martin Richard J and Martin Sondra H
Current Estimated Value
Home Financials for this Owner
Home Financials are based on the most recent Mortgage that was taken out on this home.
Original Mortgage
$221,550
Outstanding Balance
$99,515
Interest Rate
5.78%
Mortgage Type
Purchase Money Mortgage
Estimated Equity
$371,521
Purchase Details
Closed on
Sep 10, 1992
Sold by
Disanto Michael J
Bought by
Black Cynthia K
Purchase Details
Closed on
Jan 25, 1990
Bought by
Disanto Michael J
Purchase Details
Closed on
Jun 26, 1985
Bought by
Disanto Michael
Purchase Details
Closed on
Mar 29, 1985
Bought by
Transco Const Inc
Purchase Details
Closed on
Jan 1, 1978
Bought by
Lipman Paul Trs
Create a Home Valuation Report for This Property
The Home Valuation Report is an in-depth analysis detailing your home's value as well as a comparison with similar homes in the area
Home Values in the Area
Average Home Value in this Area
Purchase History
| Date | Buyer | Sale Price | Title Company |
|---|---|---|---|
| Martin Richard J | $296,500 | Landamerica | |
| Black Cynthia K | $231,000 | -- | |
| Disanto Michael J | $185,000 | -- | |
| Som Associates | -- | -- | |
| Disanto Michael | -- | -- | |
| Transco Const Inc | $20,000 | -- | |
| Lipman Paul Trs | -- | -- |
Source: Public Records
Mortgage History
| Date | Status | Borrower | Loan Amount |
|---|---|---|---|
| Open | Martin Richard J | $221,550 | |
| Closed | Martin Richard J | $60,100 |
Source: Public Records
Tax History
| Year | Tax Paid | Tax Assessment Tax Assessment Total Assessment is a certain percentage of the fair market value that is determined by local assessors to be the total taxable value of land and additions on the property. | Land | Improvement |
|---|---|---|---|---|
| 2025 | $7,158 | $140,945 | $26,250 | $114,695 |
| 2024 | $7,177 | $140,945 | $26,250 | $114,695 |
| 2023 | $7,059 | $114,670 | $32,730 | $81,940 |
| 2022 | $7,072 | $114,660 | $32,725 | $81,935 |
| 2021 | $6,991 | $114,660 | $32,730 | $81,940 |
| 2020 | $6,962 | $105,210 | $30,030 | $75,180 |
| 2019 | $6,742 | $300,600 | $85,800 | $214,800 |
| 2018 | $6,037 | $105,210 | $30,030 | $75,180 |
| 2017 | $5,899 | $97,870 | $27,760 | $70,110 |
| 2016 | $5,843 | $97,870 | $27,760 | $70,110 |
| 2015 | $5,566 | $97,870 | $27,760 | $70,110 |
| 2014 | $5,566 | $90,620 | $25,690 | $64,930 |
Source: Public Records
Map
Nearby Homes
- 5009 Lansdowne Dr
- 4775 Som Center Rd
- 32420 Tracy Ln
- 5560 Elm Hill Dr
- 30875 Cannon Rd
- 30705 Cannon Rd
- 5721 Som Center Rd Unit 25
- 5721 Som Center Rd Unit 18
- 5034 Medhurst Ave
- 5496 Stone Creek
- 34040 Sherbrook Park Dr
- S/L 12 Neptune Oval
- S/L 1 Neptune Oval
- S/L 13 Neptune Oval
- 235 E Orange Hill Cir
- 35729 Quartermane Cir
- S/L 11 Neptune Oval
- S/L 2 Neptune Oval
- S/L 3 Neptune Oval
- 5060 Neptune Oval
- 5180 Som Center Rd
- 5160 Som Center Rd
- 5150 Som Center Rd
- 5190 Som Center Rd
- 5165 Ramblewood Ct
- 5175 Ramblewood Ct
- 5140 Som Center Rd
- 5145 Ramblewood Ct
- 33095 Burlwood Dr
- 5185 Ramblewood Ct
- 32955 Burlwood Dr
- 5135 Ramblewood Ct
- 33130 Wintergreen Dr
- 33090 Wintergreen Dr
- 5125 Ramblewood Ct
- 5190 Ramblewood Ct
- 5199 Som Center Rd
- 5195 Ramblewood Ct
- 32875 Burlwood Dr
- 5151 Som Center Rd
Your Personal Tour Guide
Ask me questions while you tour the home.