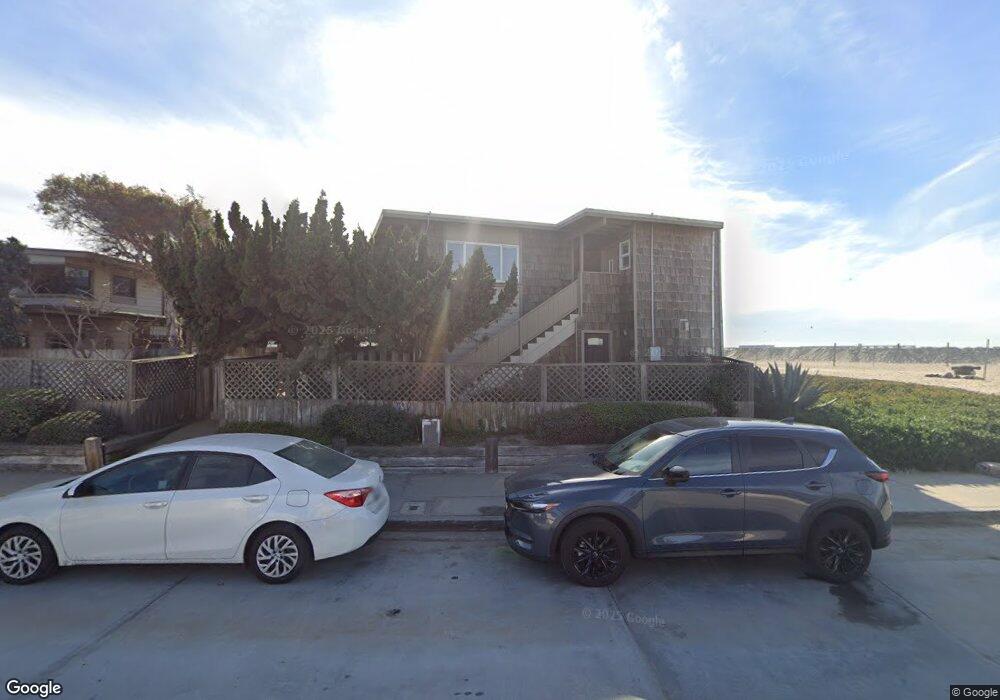
5173 Brighton Ave Unit 1 San Diego, CA 92107
Ocean Beach NeighborhoodEstimated Value: $815,000 - $1,019,000
2
Beds
1
Bath
832
Sq Ft
$1,060/Sq Ft
Est. Value
About This Home
This home is located at 5173 Brighton Ave Unit 1, San Diego, CA 92107 and is currently estimated at $881,534, approximately $1,059 per square foot. 5173 Brighton Ave Unit 1 is a home located in San Diego County with nearby schools including Ocean Beach Elementary School, Richard Henry Dana Middle School, and Correia Middle School.
Ownership History
Date
Name
Owned For
Owner Type
Purchase Details
Closed on
Mar 31, 2014
Sold by
Hofstadler Nina
Bought by
Hofstadler Nina
Current Estimated Value
Purchase Details
Closed on
Sep 27, 2011
Sold by
Herron Rockwell E and Herron Diana L
Bought by
Hofstadler Steven and Hofstadler Nina
Purchase Details
Closed on
Jul 2, 2002
Sold by
Herron Rockwell and Herron Diana
Bought by
Herron Rockwell E and Herron Diana L
Purchase Details
Closed on
Jun 28, 1995
Sold by
Great Western Bank
Bought by
Herron Rockwell and Herron Diana
Home Financials for this Owner
Home Financials are based on the most recent Mortgage that was taken out on this home.
Original Mortgage
$96,600
Interest Rate
7.62%
Purchase Details
Closed on
Apr 14, 1995
Sold by
Marrs David and Marrs Rebecca
Bought by
Great Western Bank Fsb
Create a Home Valuation Report for This Property
The Home Valuation Report is an in-depth analysis detailing your home's value as well as a comparison with similar homes in the area
Home Values in the Area
Average Home Value in this Area
Purchase History
| Date | Buyer | Sale Price | Title Company |
|---|---|---|---|
| Hofstadler Nina | -- | None Available | |
| Hofstadler Steven | $545,000 | California Title Company | |
| Herron Rockwell E | -- | -- | |
| Herron Rockwell | $138,000 | Chicago Title Co | |
| Great Western Bank Fsb | $97,625 | Orange Coast Title |
Source: Public Records
Mortgage History
| Date | Status | Borrower | Loan Amount |
|---|---|---|---|
| Previous Owner | Herron Rockwell | $96,600 |
Source: Public Records
Tax History Compared to Growth
Tax History
| Year | Tax Paid | Tax Assessment Tax Assessment Total Assessment is a certain percentage of the fair market value that is determined by local assessors to be the total taxable value of land and additions on the property. | Land | Improvement |
|---|---|---|---|---|
| 2025 | $8,274 | $684,538 | $590,340 | $94,198 |
| 2024 | $8,274 | $671,116 | $578,765 | $92,351 |
| 2023 | $8,091 | $657,958 | $567,417 | $90,541 |
| 2022 | $7,877 | $645,058 | $556,292 | $88,766 |
| 2021 | $7,823 | $632,411 | $545,385 | $87,026 |
| 2020 | $7,728 | $625,927 | $539,793 | $86,134 |
| 2019 | $7,591 | $613,655 | $529,209 | $84,446 |
| 2018 | $7,097 | $601,624 | $518,833 | $82,791 |
| 2017 | $6,928 | $589,828 | $508,660 | $81,168 |
| 2016 | $6,819 | $578,264 | $498,687 | $79,577 |
| 2015 | $6,718 | $569,579 | $491,197 | $78,382 |
| 2014 | $6,612 | $558,423 | $481,576 | $76,847 |
Source: Public Records
Map
Nearby Homes
- 5152 Brighton Ave
- 5123 Lotus St
- 5035 Saratoga Ave
- 1975 Bacon St
- 4922 Muir Ave
- 5038-40 W Point Loma Blvd
- 5036 W Point Loma Blvd
- 4804 Cape May Ave
- 4985 Narragansett Ave Unit 87
- 4725 Saratoga Ave
- 2617 Ocean Front Walk
- 2623 Ocean Front Walk
- 2632 Bayside Walk
- 4685 Long Branch Ave
- 801 Allerton Ct
- 1817-19 Sunset Cliffs Blvd
- 4674 Saratoga Ave Unit 2
- 722 San Luis Rey Place Unit 24
- 814 San Luis Rey Place Unit 16
- 818 San Luis Rey Place Unit 20
- 5173 Brighton Ave Unit 4
- 5173 Brighton Ave Unit 10
- 5173 Brighton Ave Unit 9
- 5173 Brighton Ave Unit 7
- 5173 Brighton Ave Unit 6
- 5173 Brighton Ave Unit 5
- 5173 Brighton Ave Unit 3
- 5173 Brighton Ave Unit 2
- 5159 Brighton Ave Unit 61
- 5155 Brighton Ave Unit 57
- 5160 Cape May Ave
- 5168-76 Brighton Ave
- 5168 Brighton Ave
- 5162 Cape May Ave
- 5143-51 Brighton Ave
- 5160A Brighton Ave Unit F
- 5160 Brighton Ave Unit D
- 5176 Brighton Ave
- 5154 Brighton Ave Unit 58
- 5143 Brighton Ave